Data Visualization & API Delivery (Level 4)
6.1 Query To JSON (REST API)
Expose any Active query as a JSON REST endpoint - no deployment step required.
Navigate: Data Visualization → Query To JSON.
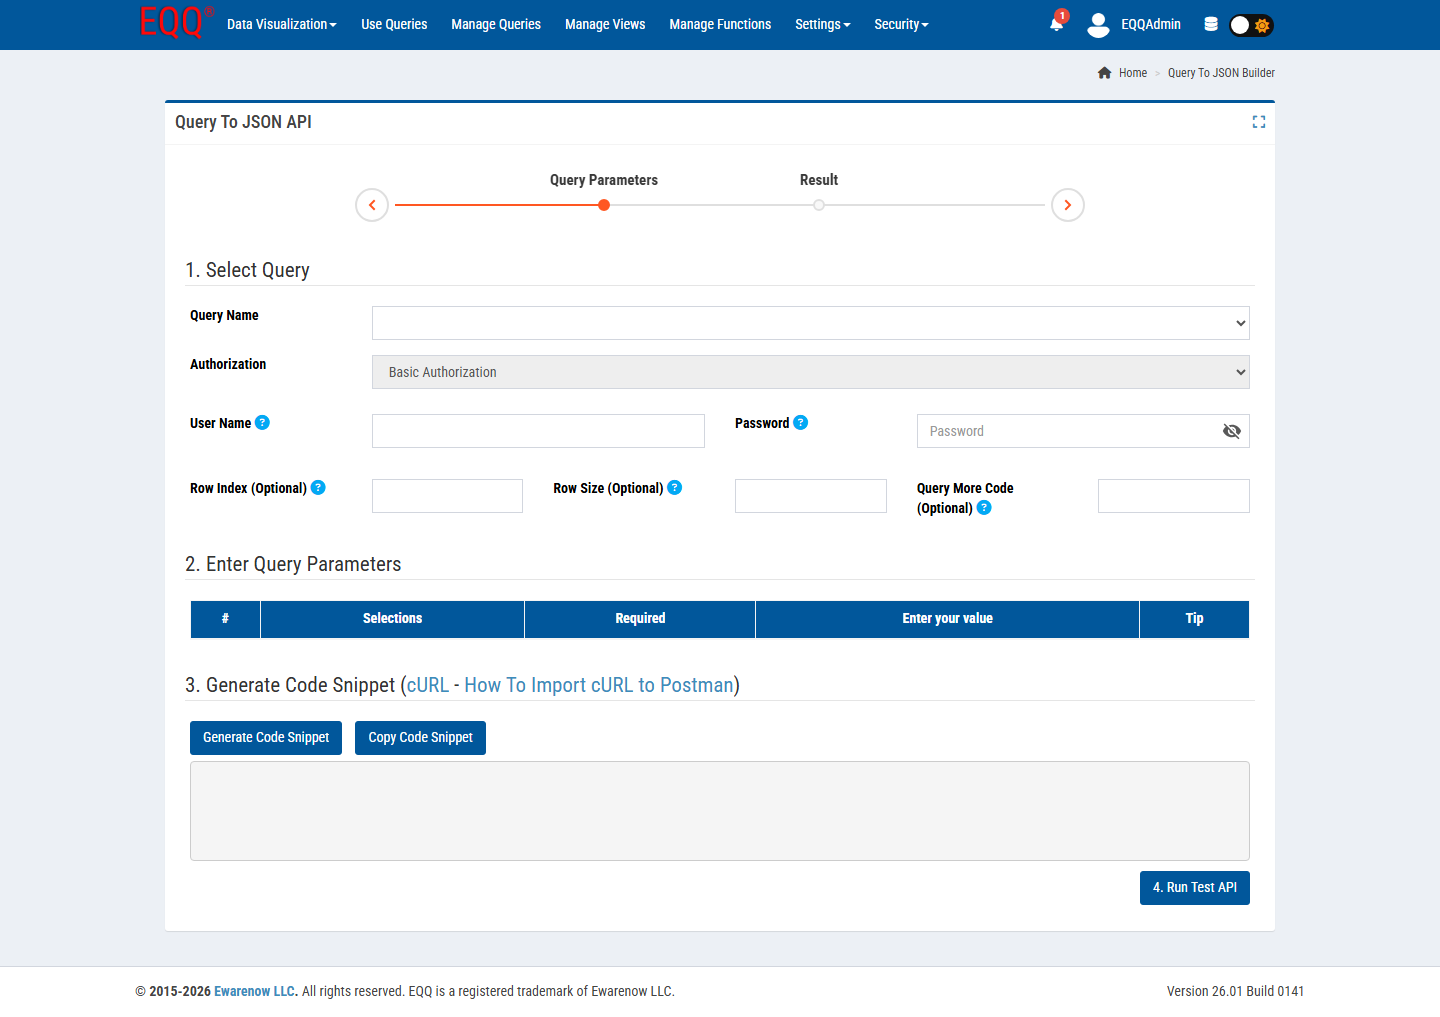
The builder has two steps on a progress bar: Query Parameters → Result.
Step 1 - Select Query
| Field | Purpose |
|---|---|
| Query Name | Dropdown of Active queries the current user can run. |
| Authorization | Basic Authorization (username + password) or API Key (X-API-Key header). |
| User Name | (Basic only) - the EQQ account that will execute the call. |
| Password | (Basic only). |
| Row Index | Optional - zero-based offset for paging. |
| Row Size | Optional - page size; overrides the default. |
| Query More Code | Optional - paging continuation token returned by a prior call. |
Step 2 - Enter Query Parameters
Auto-generated table of every parameter declared in the query. Fill in Required values.
Step 3 - Generate Code Snippet
Click Generate Code Snippet to produce a working cURL command (importable into Postman via the linked help). Click Copy Code Snippet to put it on your clipboard.
Example snippet:
curl -X POST "https://eqq.ewarenow.com/api/query/execute/Demo_All_customers_and_the_items_they_ordered" \
 -H "X-API-Key: eqq_live_9f8c2a..." \
 -H "Content-Type: application/json" \
 -d '{"rowSize":100}'
Step 4 - Run Test API
Executes the call from the browser and shows the JSON response on the Result step. Use this to validate auth, parameters, and the JSON shape before handing the snippet to a developer.
Response paging
When a result exceeds a single page, the JSON includes a queryMoreCode field. Pass it back as Query More Code on the next call.
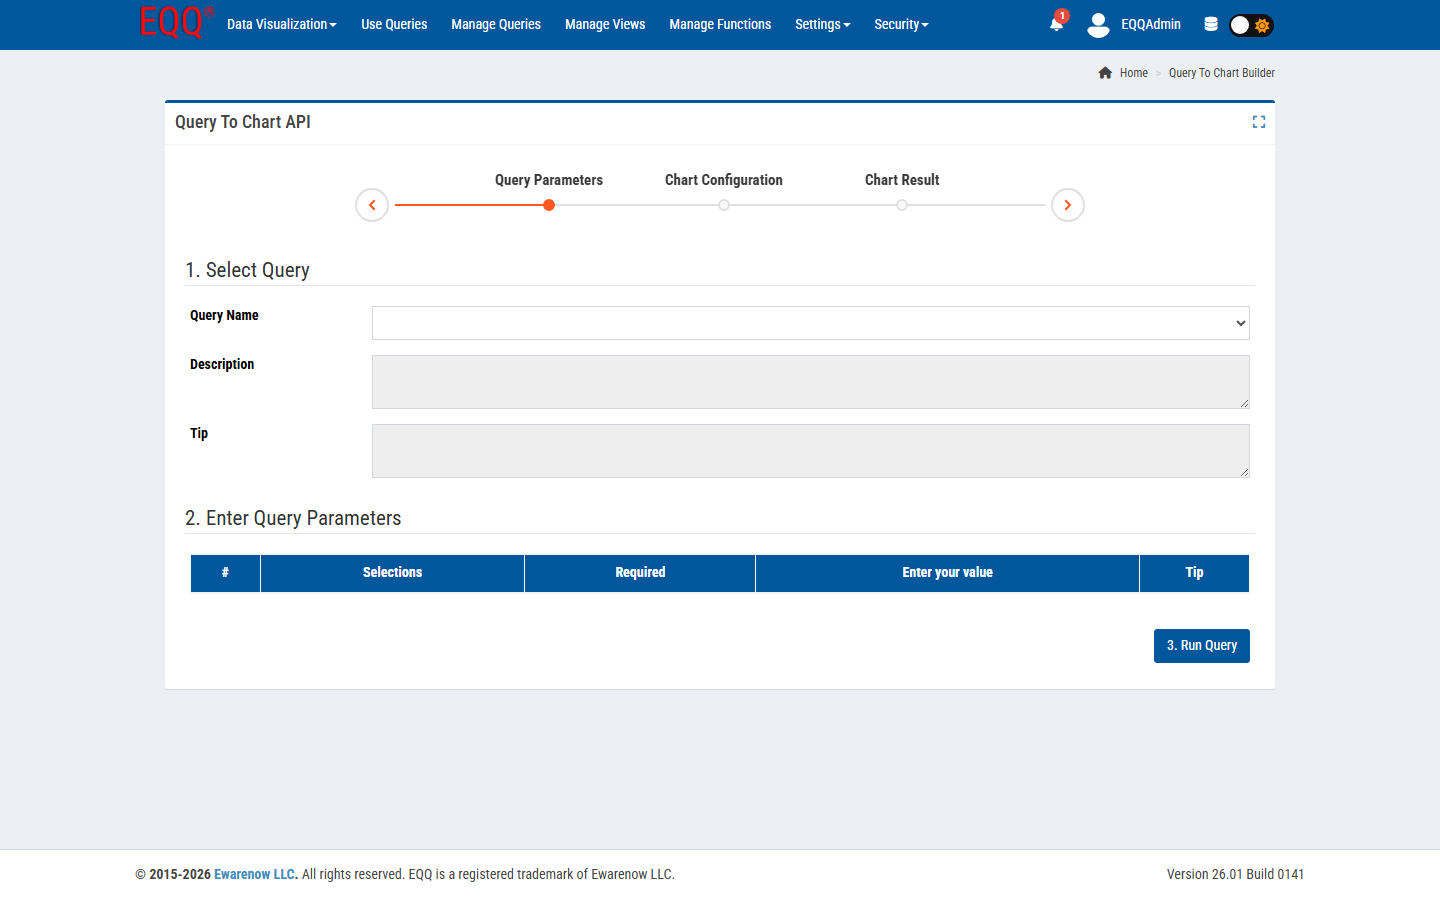
6.2 Query To Chart
Render any Active query as an interactive chart and optionally embed it in any external system — no coding required.
Navigate: Data Visualization → Query To Chart.
Three-step wizard: Query Parameters → Chart Configuration → Chart Result.
Step 1 - Query Parameters
Select a query from the Query Name dropdown. The Description and Tip fields auto-fill from the query definition. If the query has parameters, a table appears where you enter the required values. Click Run Query to fetch the data and move to the next step.
Step 2 - Chart Configuration
EQQ auto-populates Label Column (x-axis / categories) and Data Column (y-axis / values) from the query result columns. Set a Chart Title, then pick a Chart Type from the dropdown.
Available chart types
| Chart Type | Best used for |
|---|---|
| Bar Chart | Comparing values across categories |
| Line Chart | Trends over time or ordered categories |
| Area Chart | Cumulative or stacked trends over time |
| Scatter Chart | Correlation between two numeric variables |
| Pie Chart | Part-to-whole proportions (few categories) |
| Doughnut Chart | Part-to-whole with a hollow center for KPI callout |
| Polar Area Chart | Cyclic or radial comparisons |
| Radar Chart | Multi-variable performance profiles |
| Radial Bar Chart | Progress toward a goal per category |
| Heatmap Chart | Density or intensity across a two-dimensional grid |
| Treemap Chart | Hierarchical proportions as nested rectangles |
| Box Plot Chart | Statistical distribution (median, quartiles, outliers) |
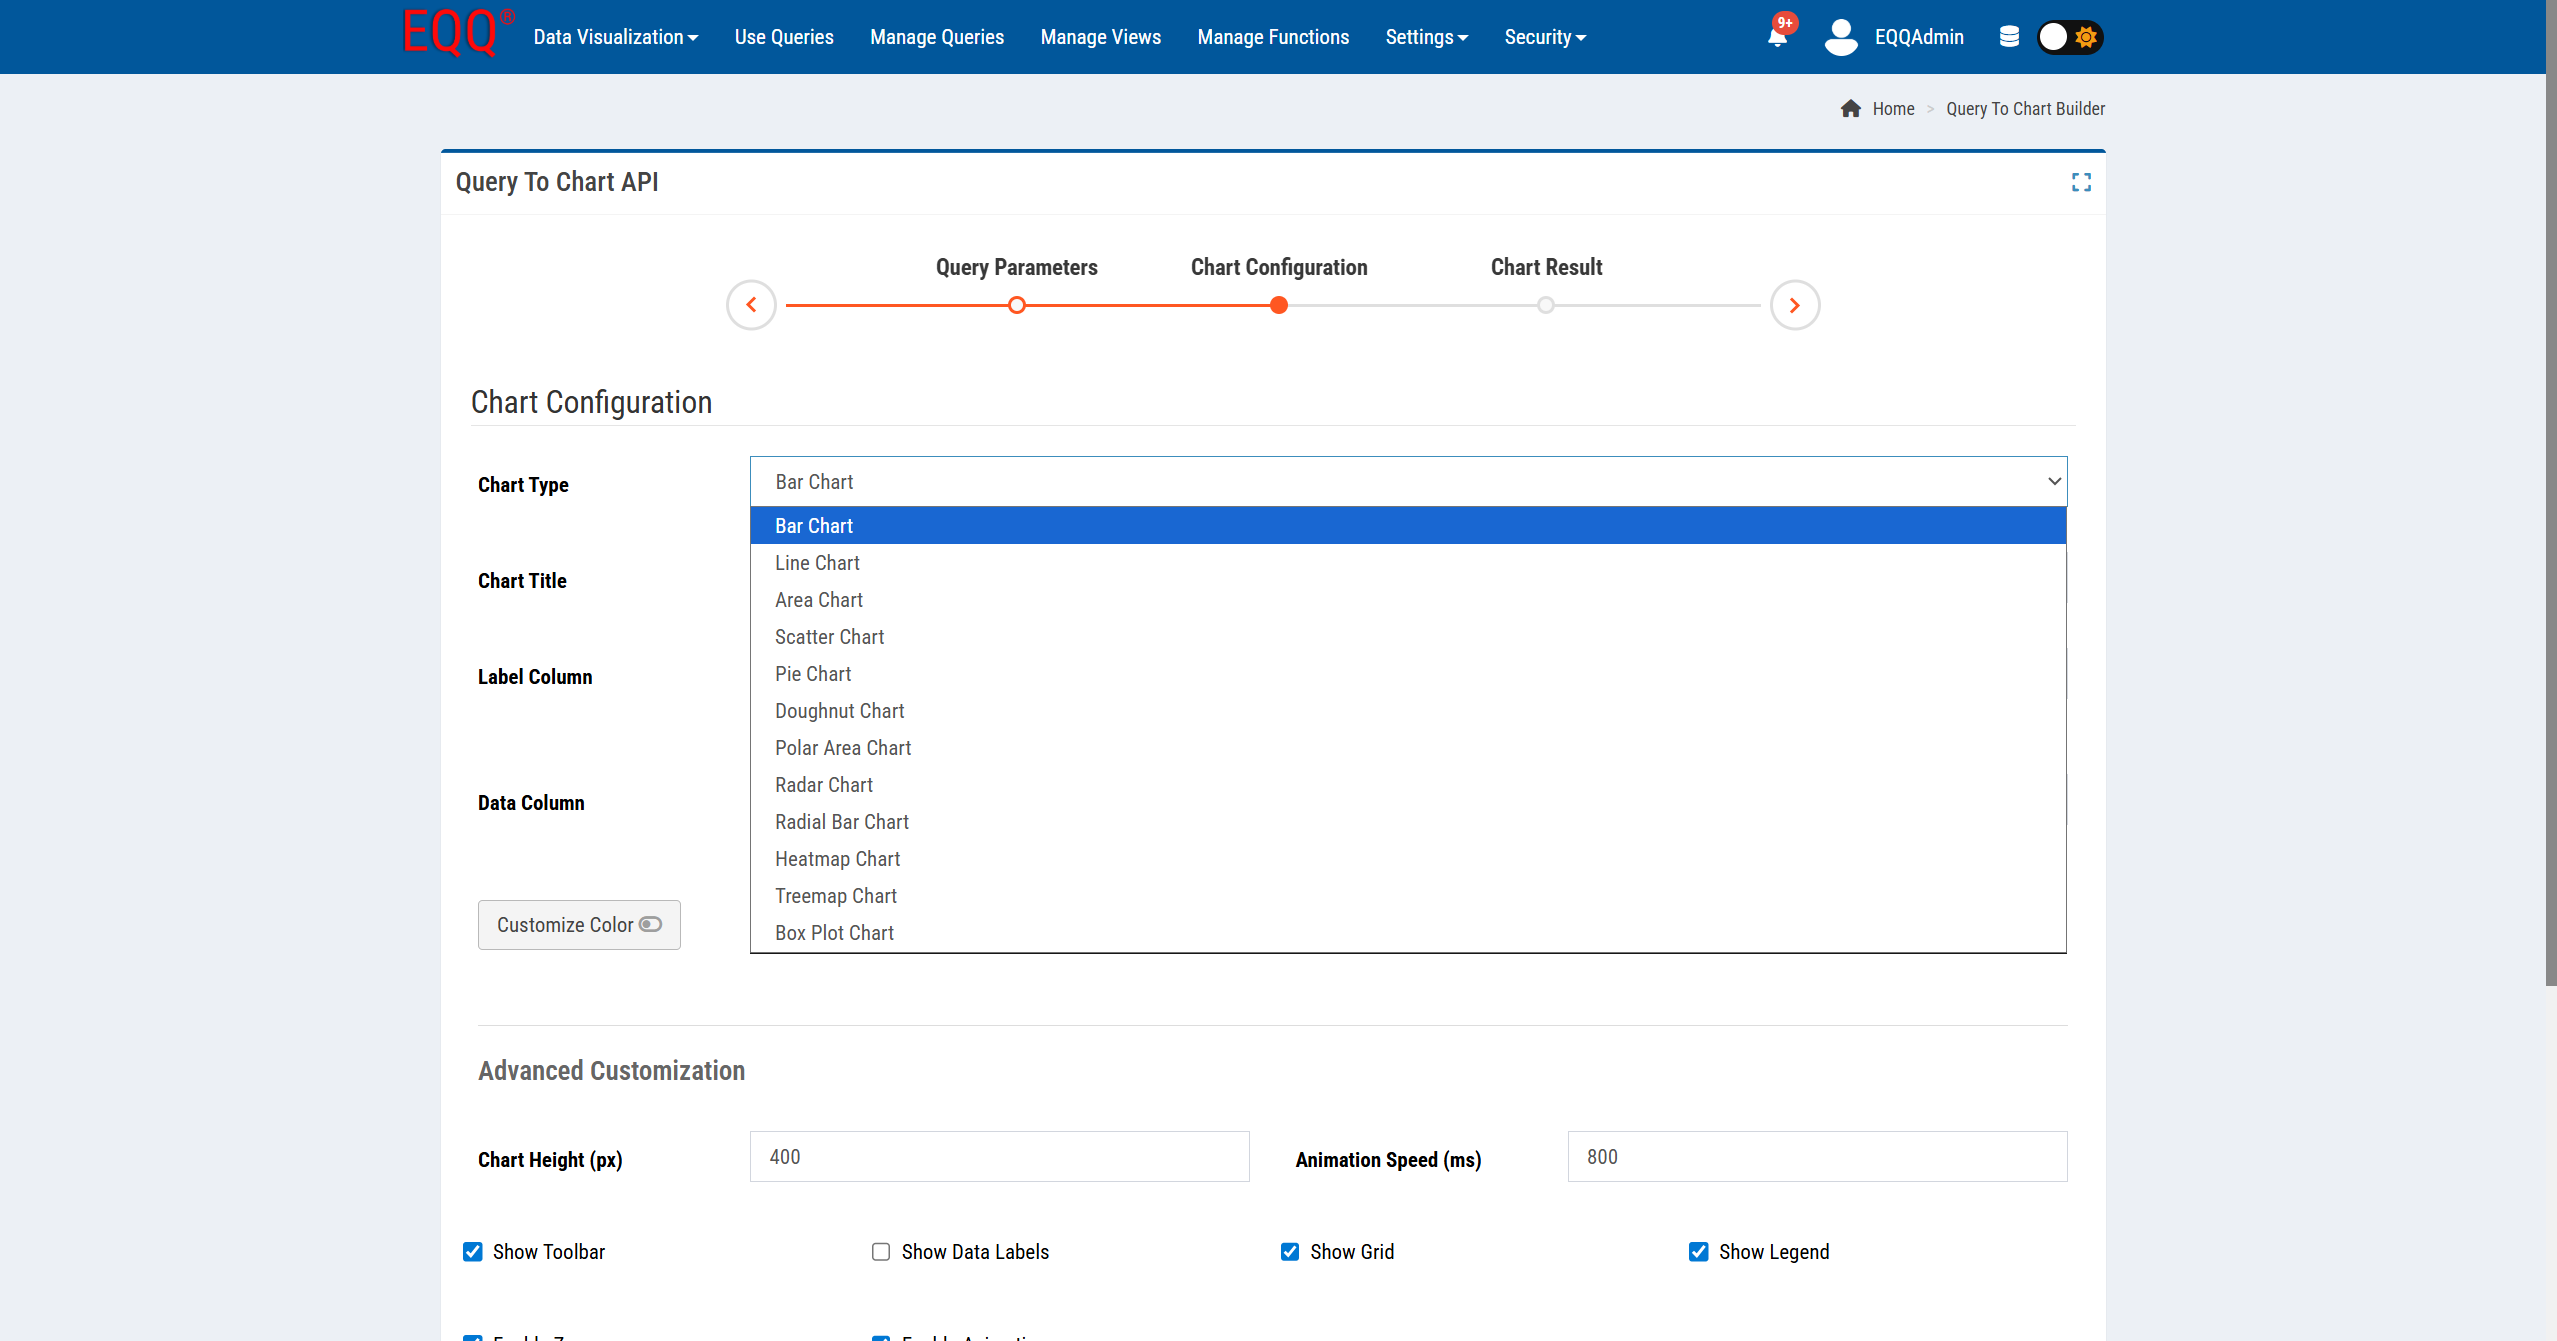
Advanced Customization
| Option | Description |
|---|---|
| Chart Height (px) | Pixel height of the rendered chart (default 400) |
| Animation Speed (ms) | Duration of the load animation in milliseconds (default 800) |
| Show Toolbar | Toggle the zoom/pan/download toolbar |
| Show Data Labels | Display values directly on each data point |
| Show Grid | Show background grid lines |
| Show Legend | Show the series legend |
| Enable Zoom | Allow mouse-wheel or pinch zoom on the chart |
| Enable Animations | Animate the chart on initial render |
| Bar Orientation | Vertical or Horizontal (Bar charts only) |
| Bar Width (%) | Column width as a percentage of available space |
| Legend Position | Top, Bottom, Left, or Right |
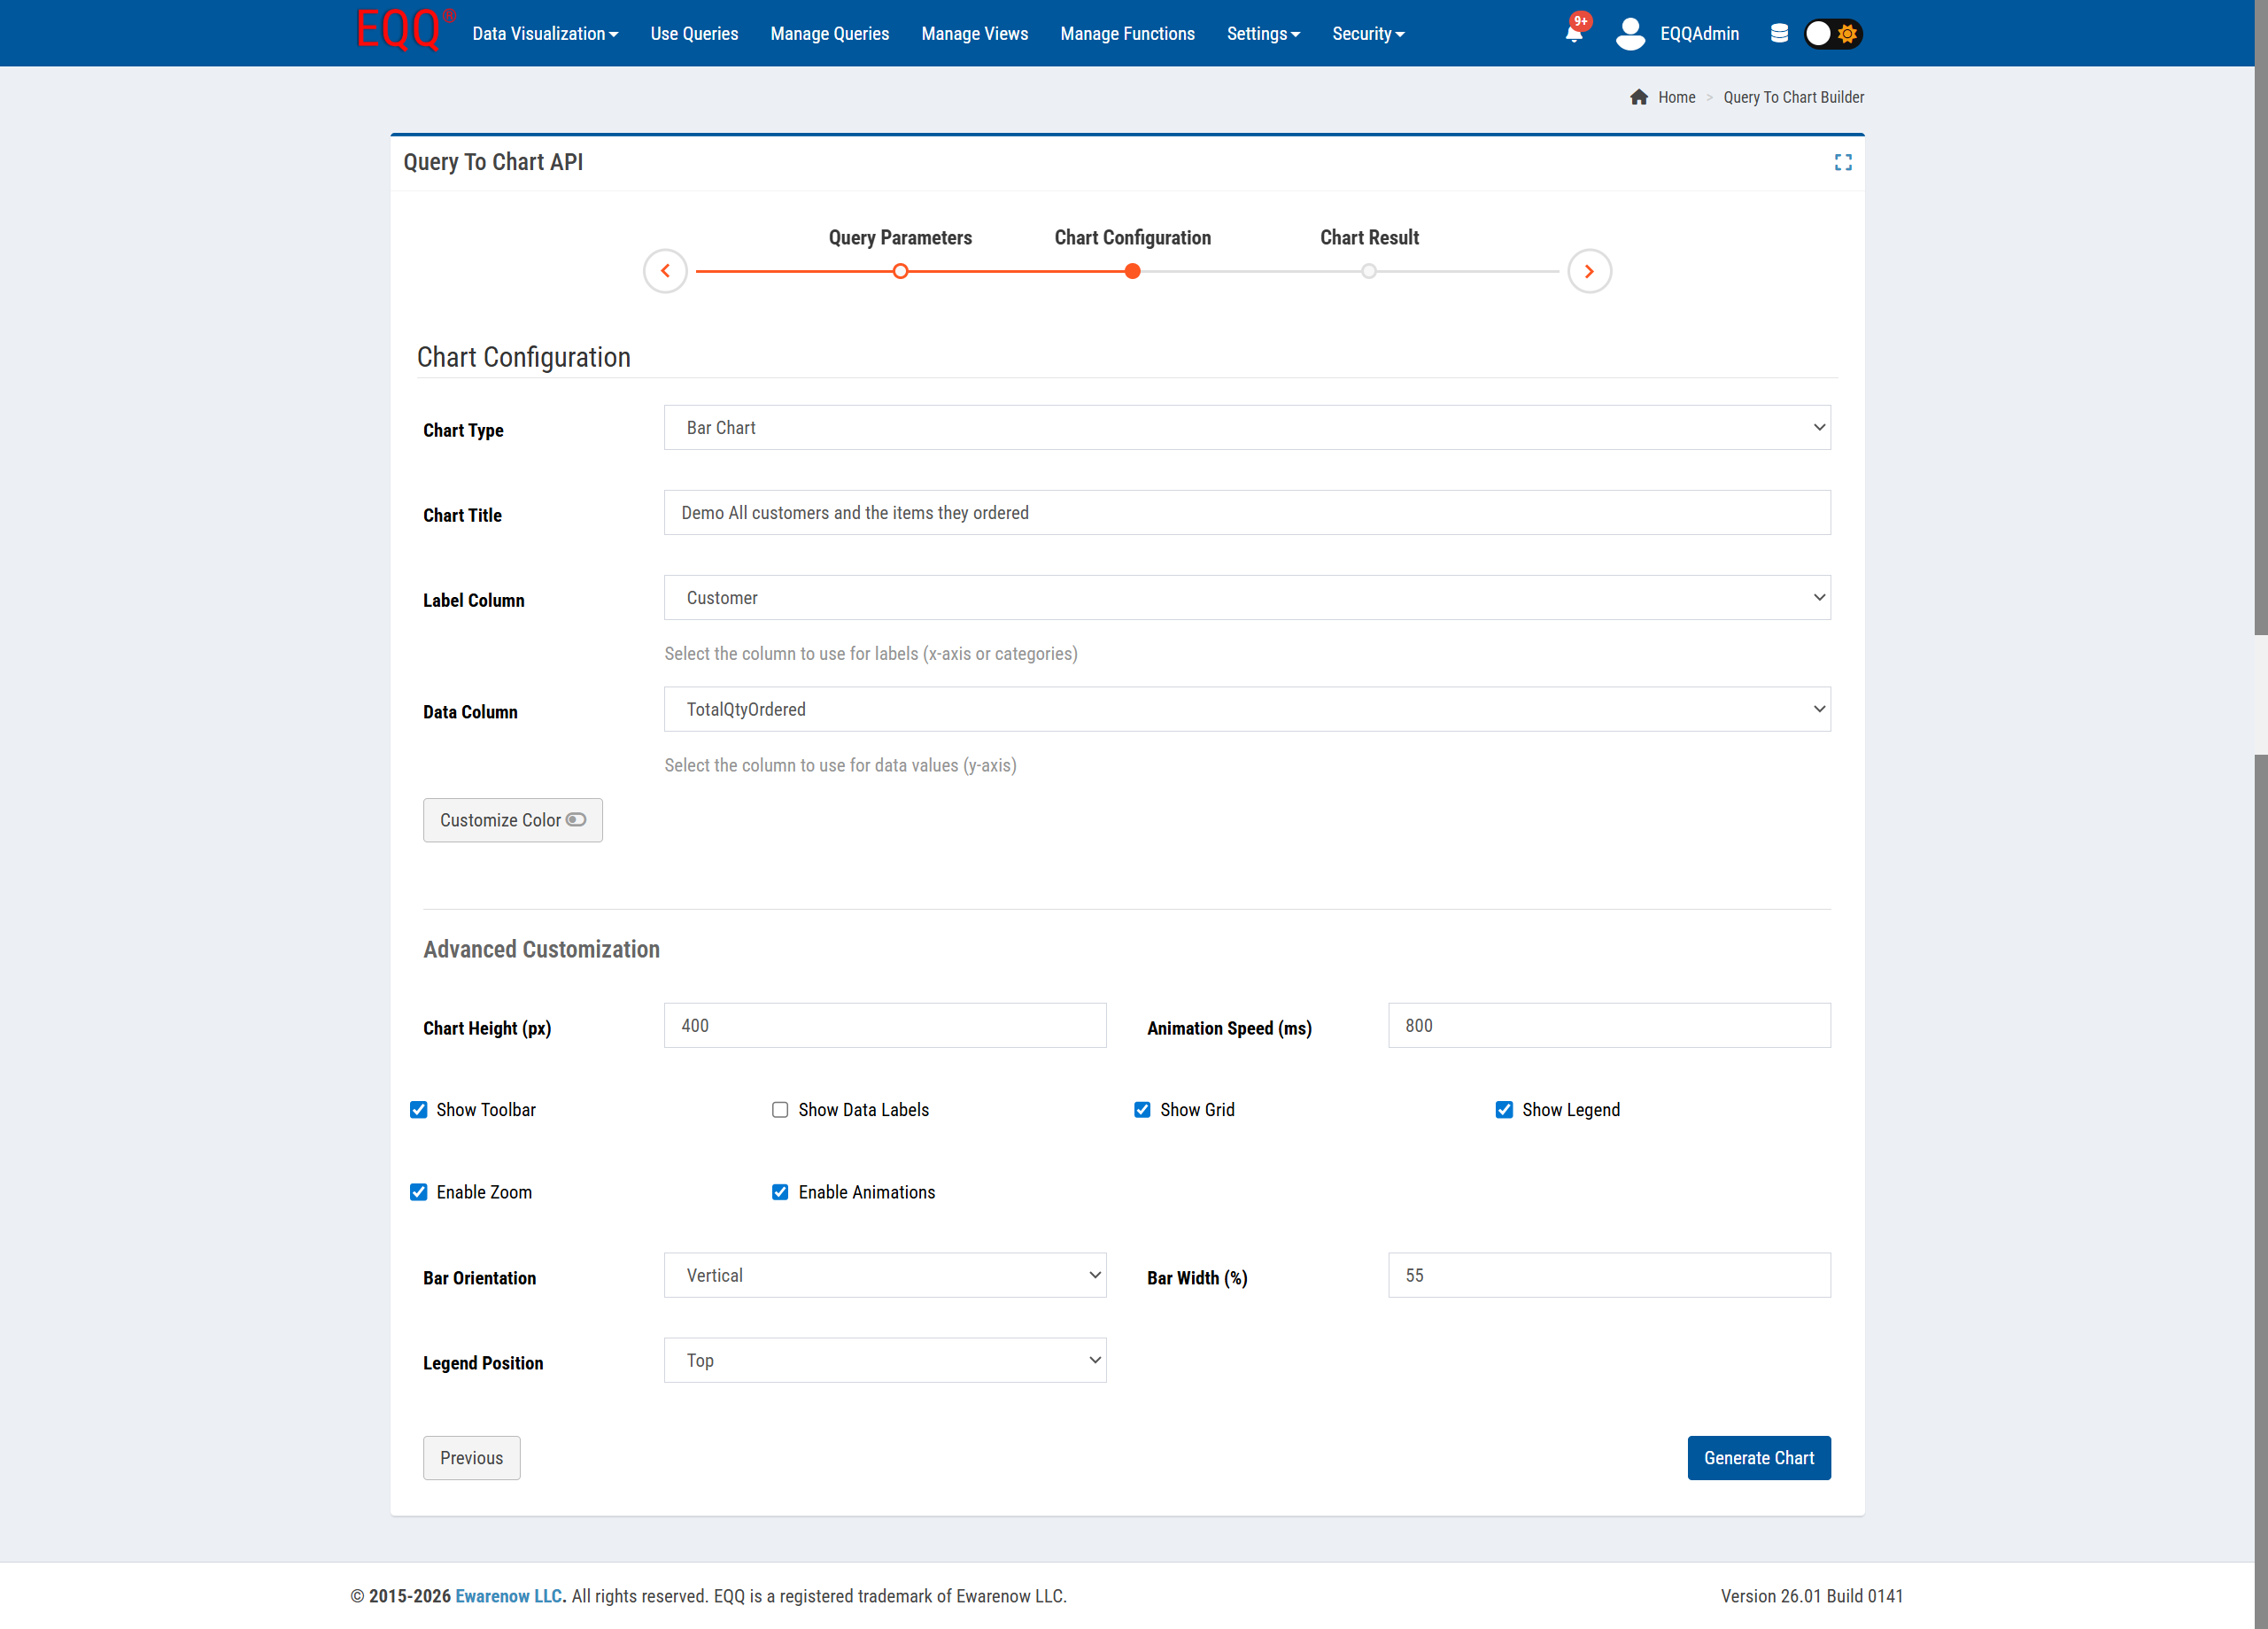
Click Generate Chart to render the result.
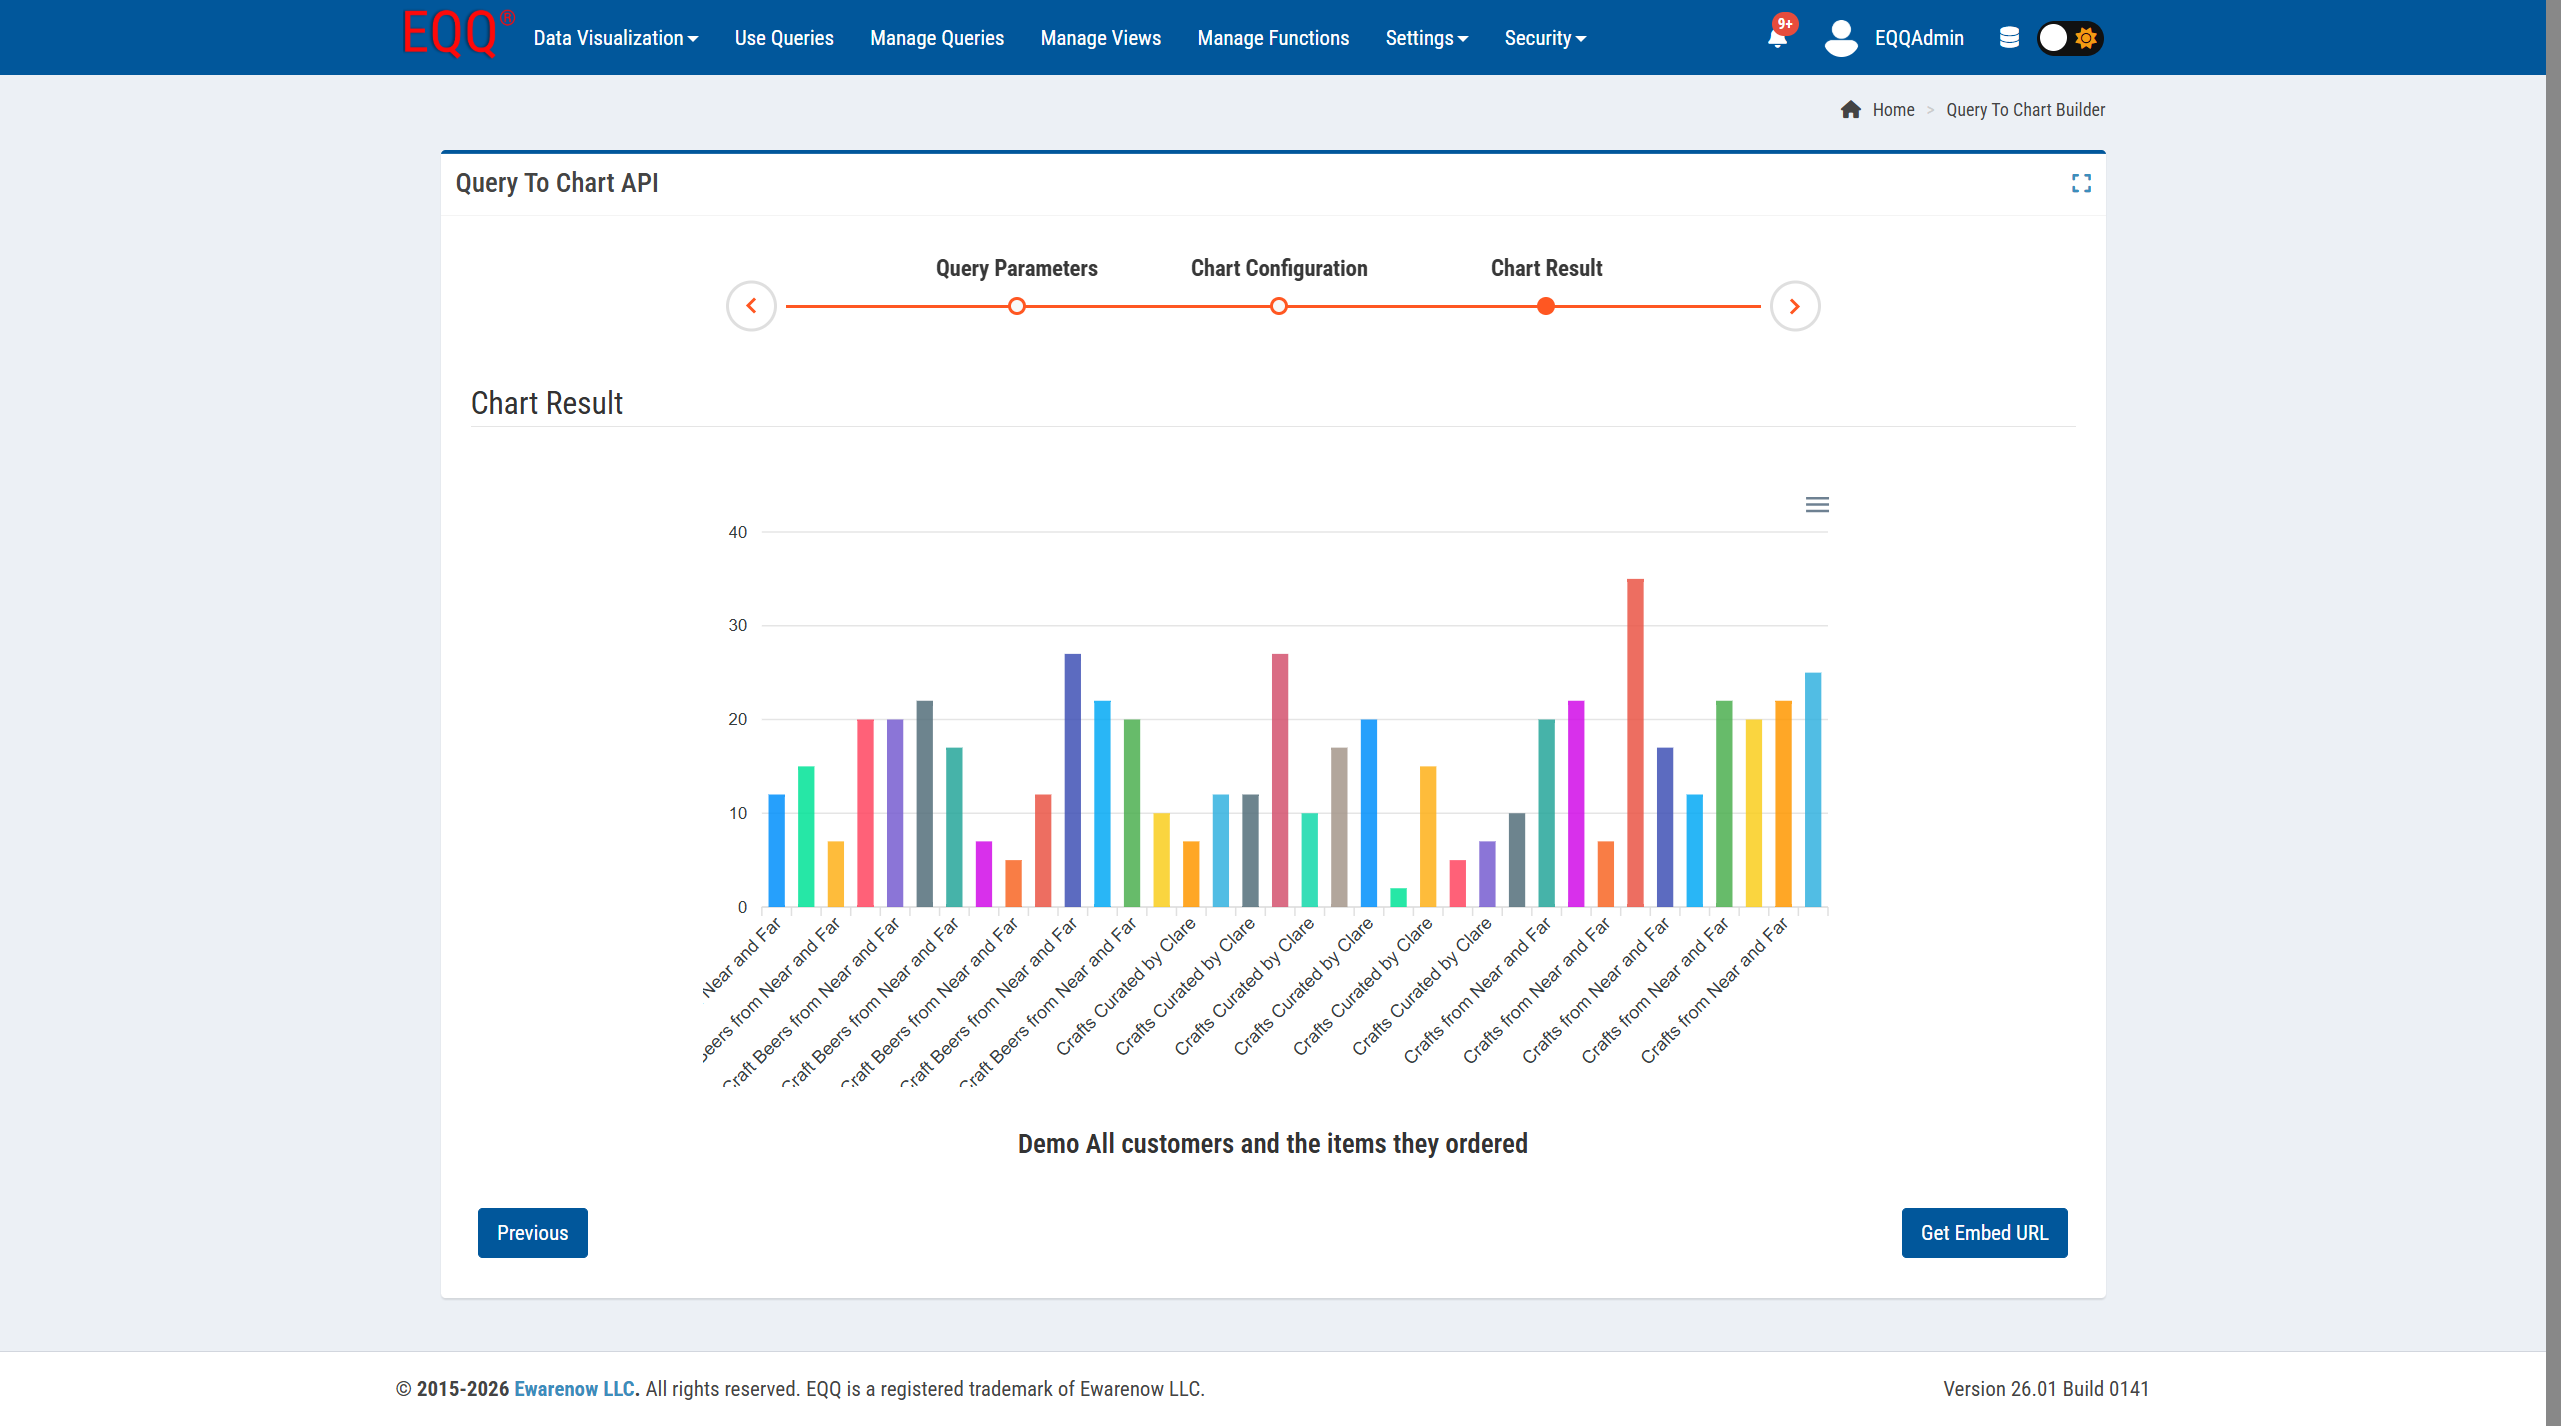
Step 3 - Chart Result
The live-rendered chart appears with an interactive toolbar for zoom, pan, reset, and download as PNG/SVG. Click Previous to go back and adjust the configuration at any time.
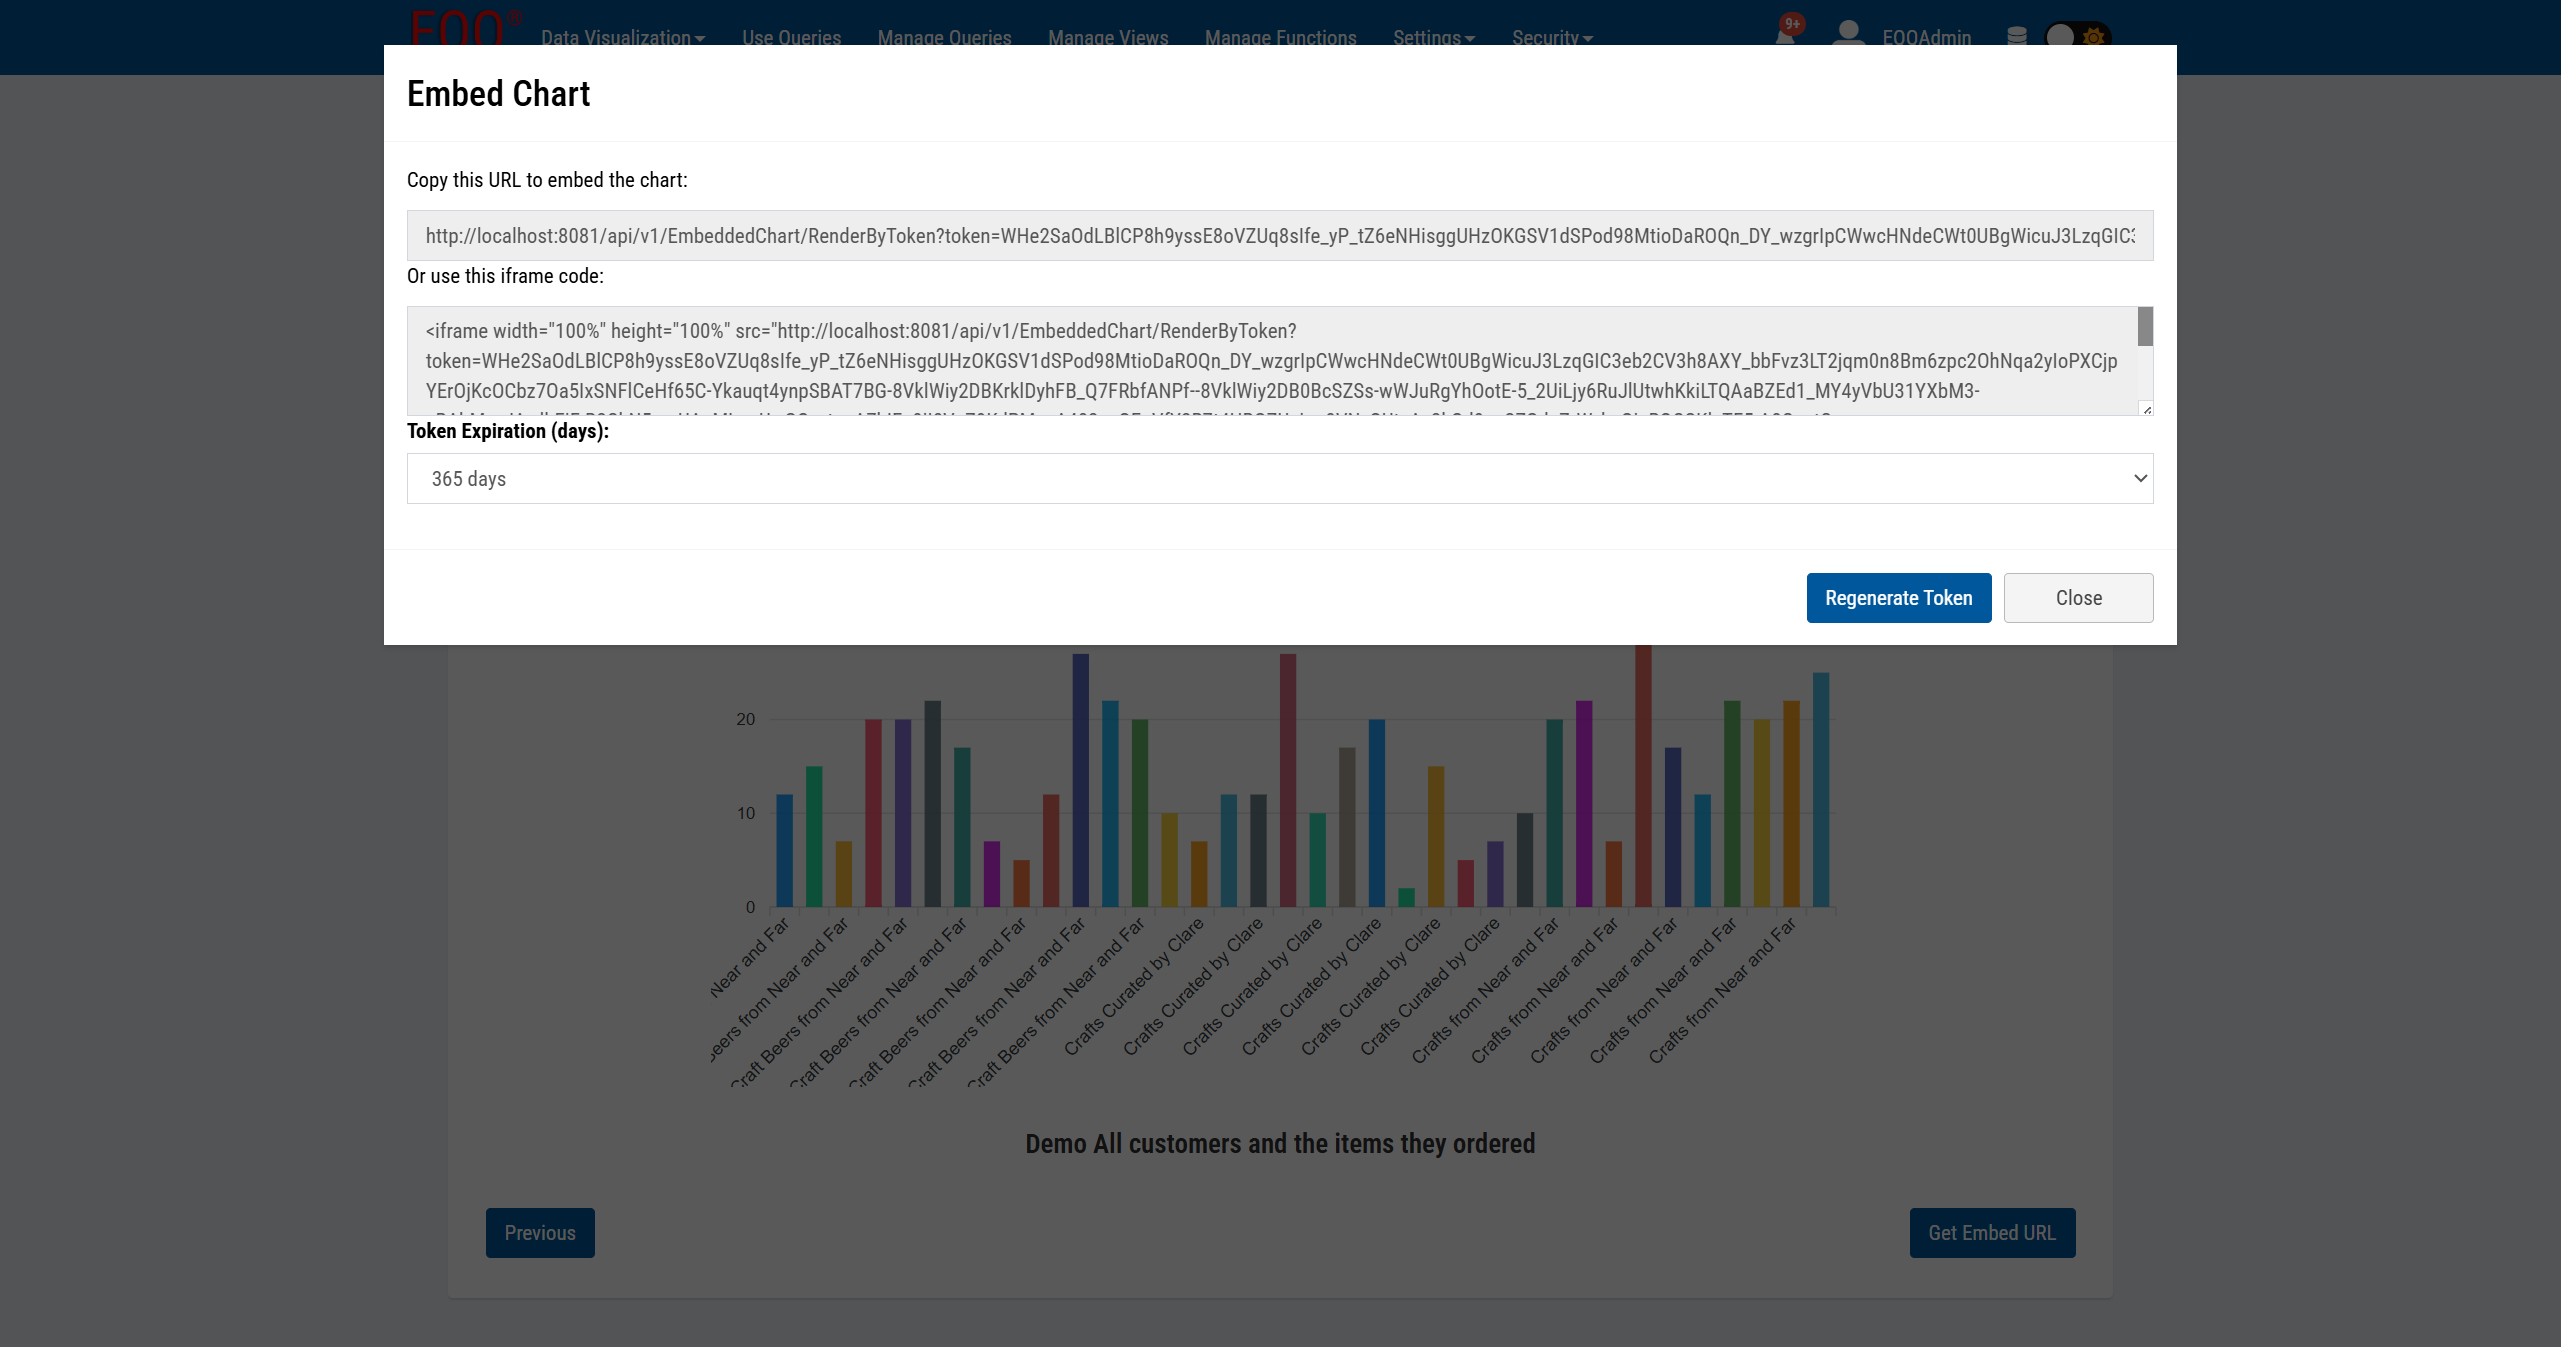
Embedding Charts in External Systems
Extended Edition feature
The Get Embed URL button appears on the Chart Result step and opens the Embed Chart dialog.
The dialog provides two ways to embed the chart:
- Embed URL — a direct link to the chart renderer, protected by an access token. Use this in any system that accepts a URL.
- iframe code — a ready-to-paste HTML snippet. Drop it into any web page, portal, intranet, or dashboard to display a live, auto-refreshing chart without requiring viewers to log in to EQQ.
Token expiration
Use the Token Expiration (days) dropdown to control how long the embedded chart remains accessible:
| Setting | Behaviour |
|---|---|
| A number of days (e.g. 30, 90, 365) | The token becomes invalid after that many days. Useful for time-limited reports or external sharing. |
| Never expire | The token stays valid indefinitely. Suitable for permanent dashboards embedded in internal portals. |
Click Regenerate Token at any time to immediately invalidate the old token and issue a new one — for example, after revoking access for a specific recipient.