Views and Queries
Views are governed, projected windows into your source tables - they pick columns, define joins, and give friendly names. Queries are parameterized questions built on top of a single View. Queries are always built on Views; they never reference raw tables directly.
Manage Views
Navigate: top bar → Manage Views.
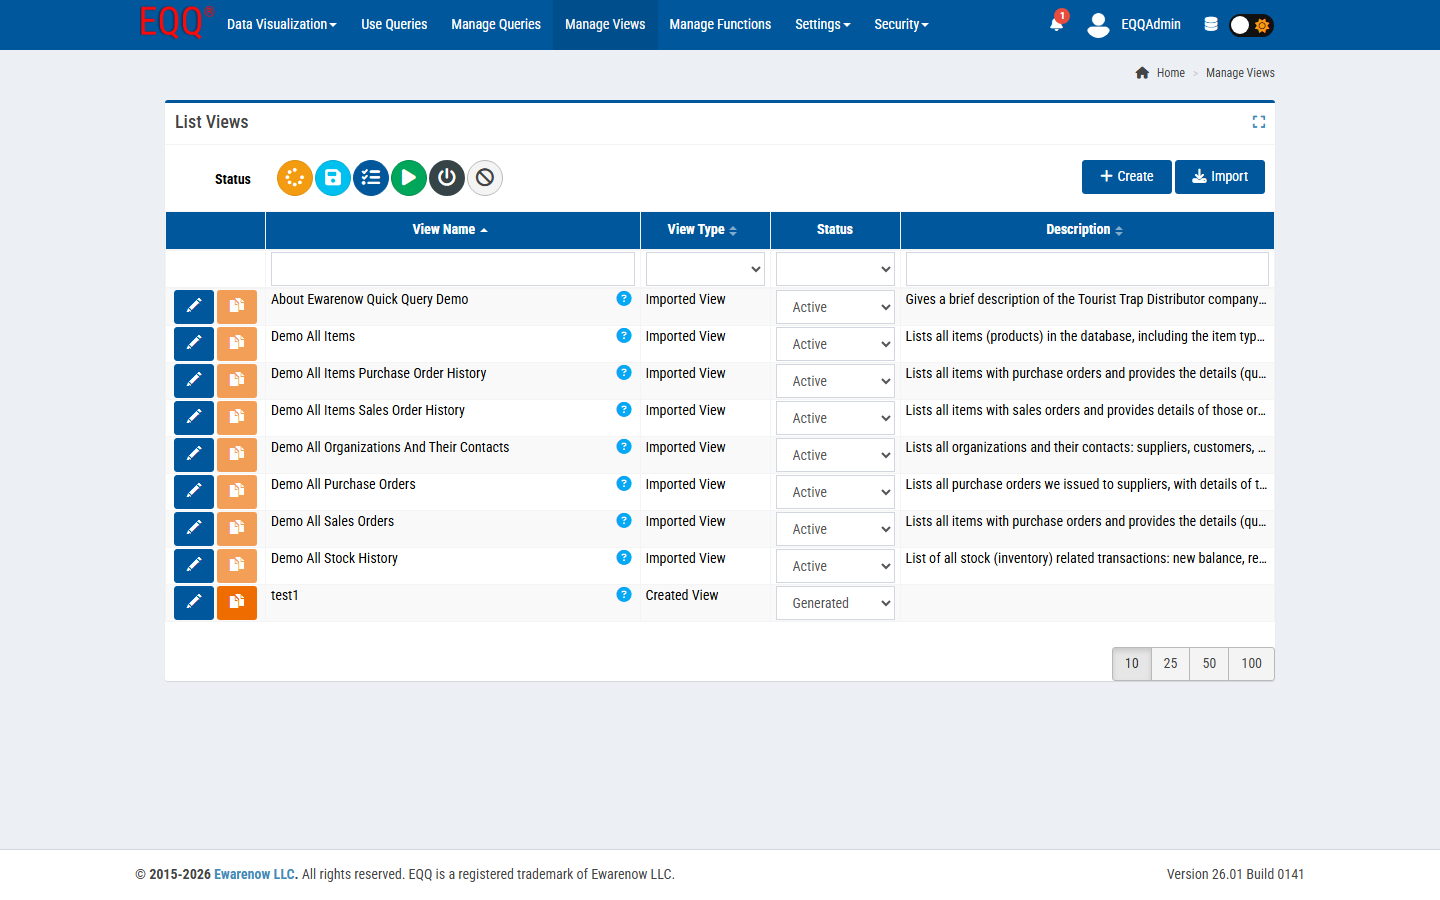
Toolbar
- Status filter row - color-coded icons, one per lifecycle state (see Lifecycle States below). Click to filter.
- + Create - opens the View wizard (see below).
- Import - bulk-import a View definition file (
.jsonor.xml) exported from another EQQ instance.
Row actions
| Icon | Action |
|---|---|
| Blue pencil | Edit the View definition |
| Orange copy | Clone the View (new technical name, same structure) |
| Blue "?" (tip) | Hover to see the View's authored tip |
Columns: View Name, View Type (Imported View vs Created View), Status, Description.
Rule of thumb
One View per real-world entity (Customers, Orders, Items). Add joins here, not in Queries.
The View wizard
Click + Create, or the pencil on an existing View. The editor is a 5-step wizard with the same always-visible toolbar as the Query editor: Undo Recent / Close Page / Save All / Generate View / Test View / Activate View / Inactivate View / Void View / Clone View.
Step 1 - Basic Information
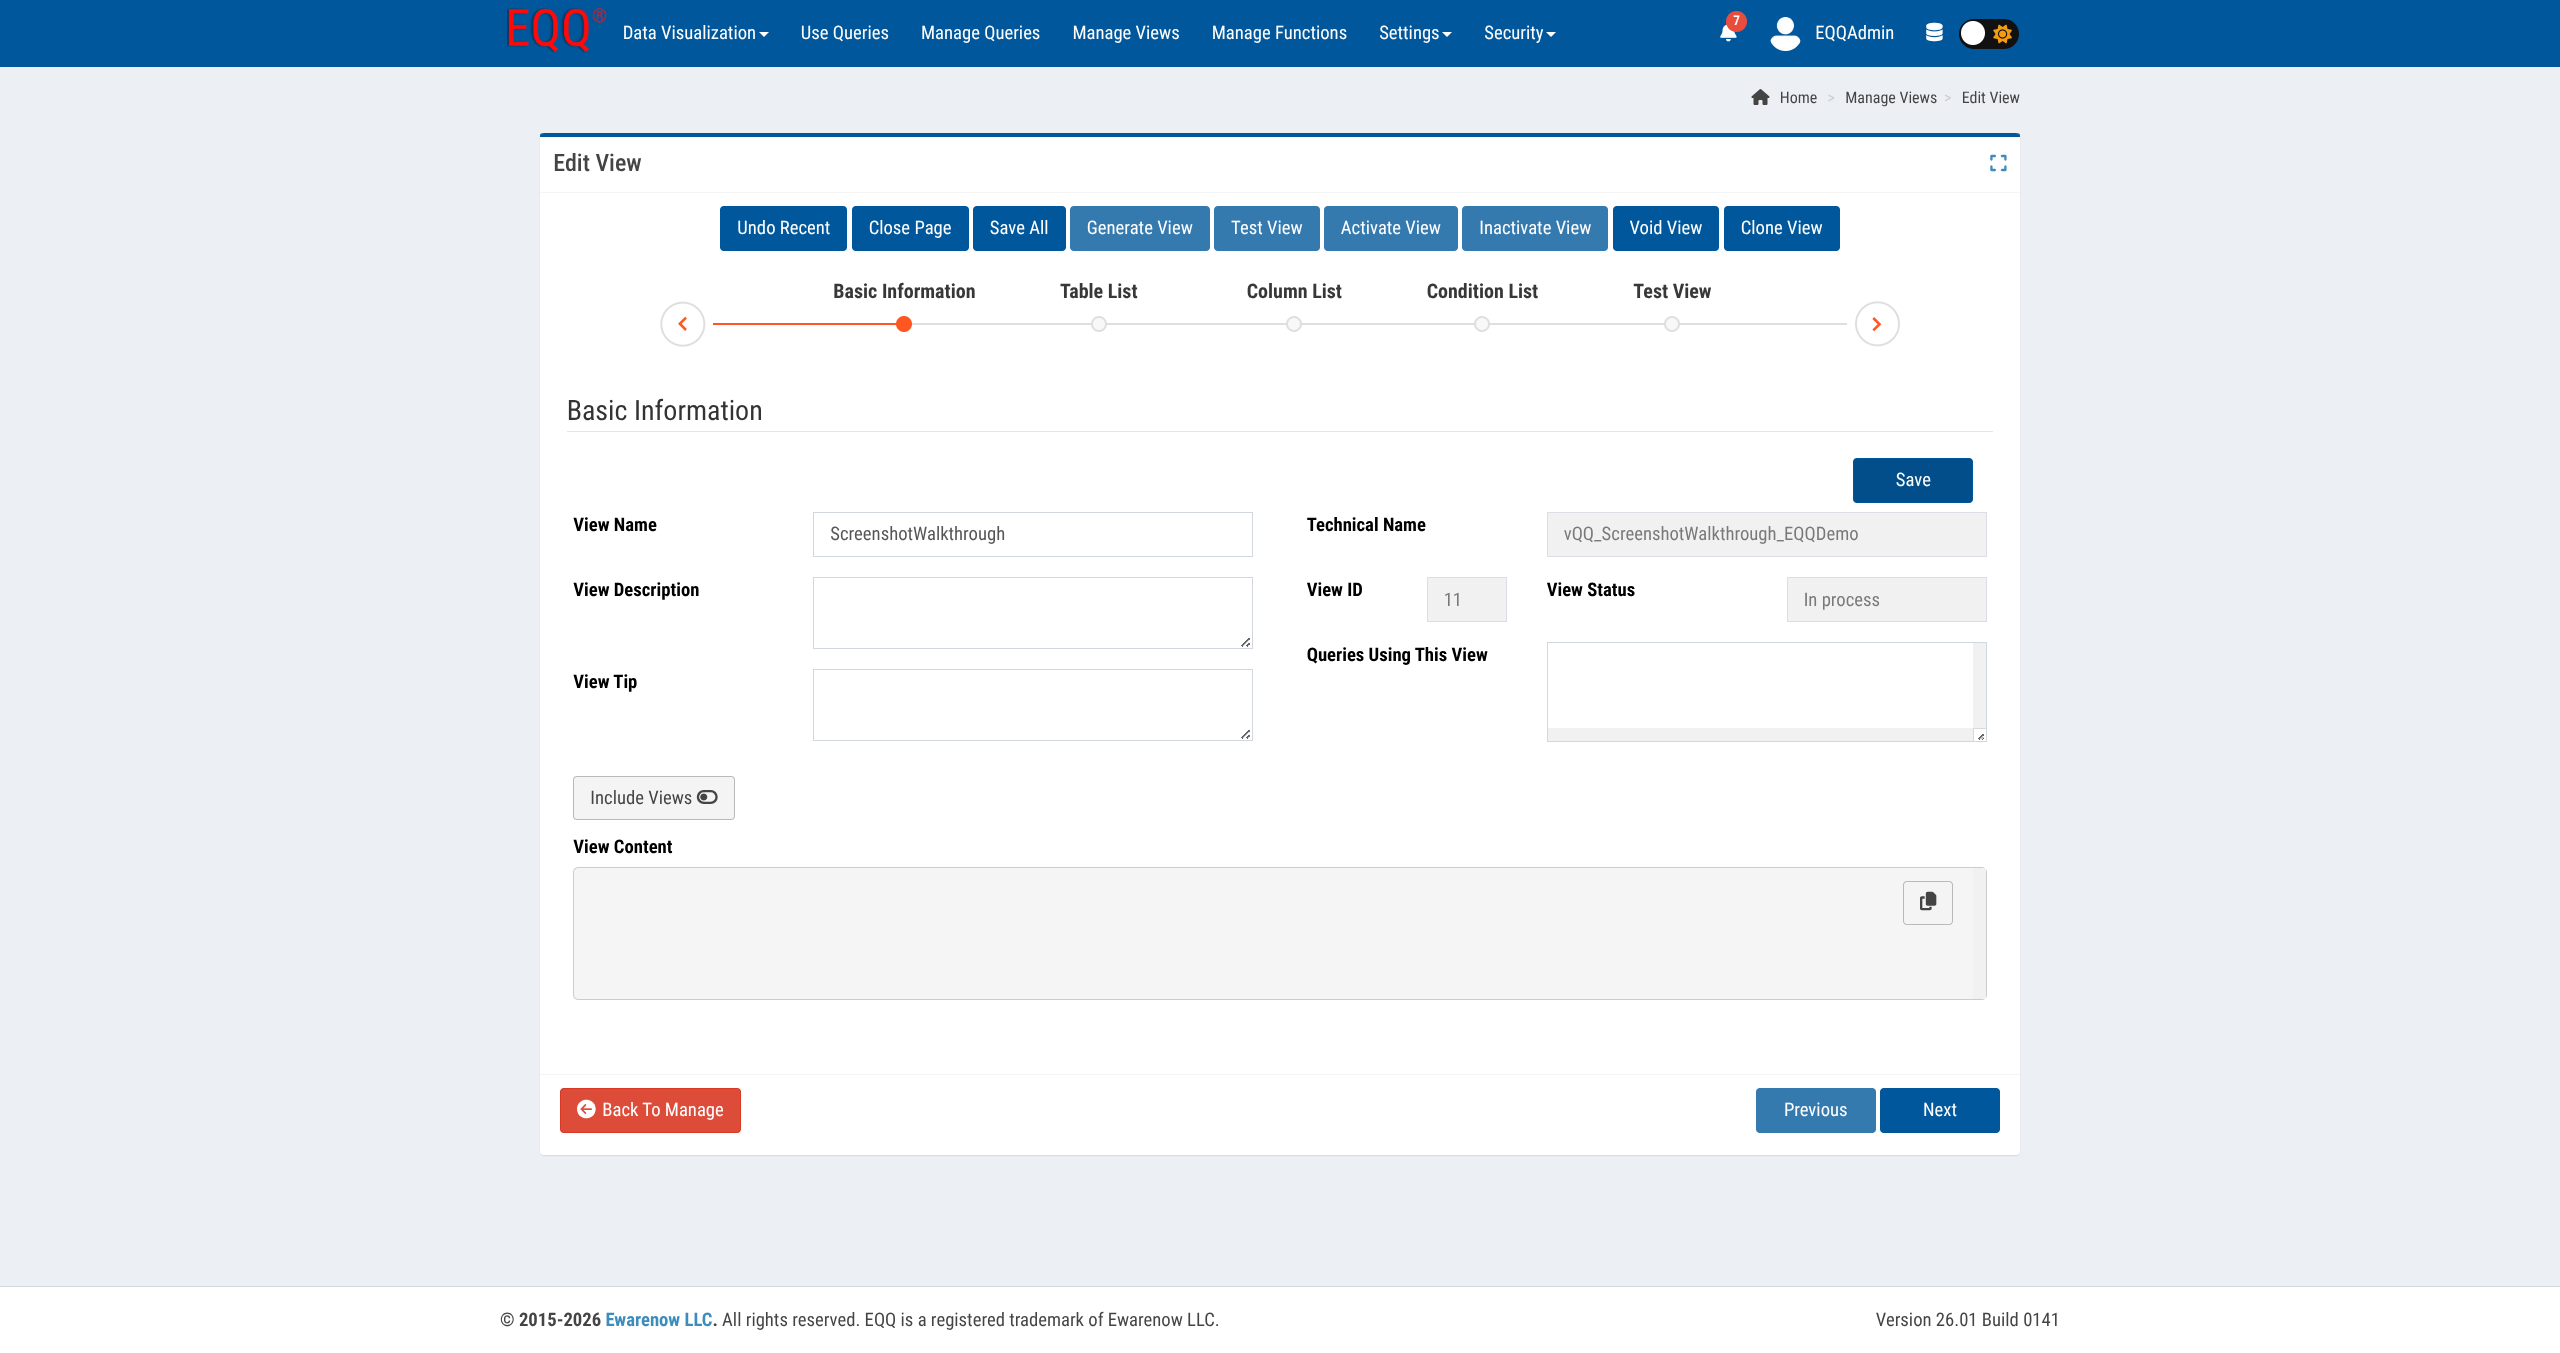
| Field | Purpose |
|---|---|
| View Name | Friendly name |
| Technical Name | Auto-generated, read-only |
| View Description | Optional, internal |
| View Tip | Optional, shown to designers who reuse this View |
| Include Views | Advanced: build this View from other Views instead of raw tables |
| Union Views | Advanced: combine multiple Views with UNION [ALL] |
Click this step's own Save button (not the top toolbar) to unlock the remaining steps.
Step 2 - Table List
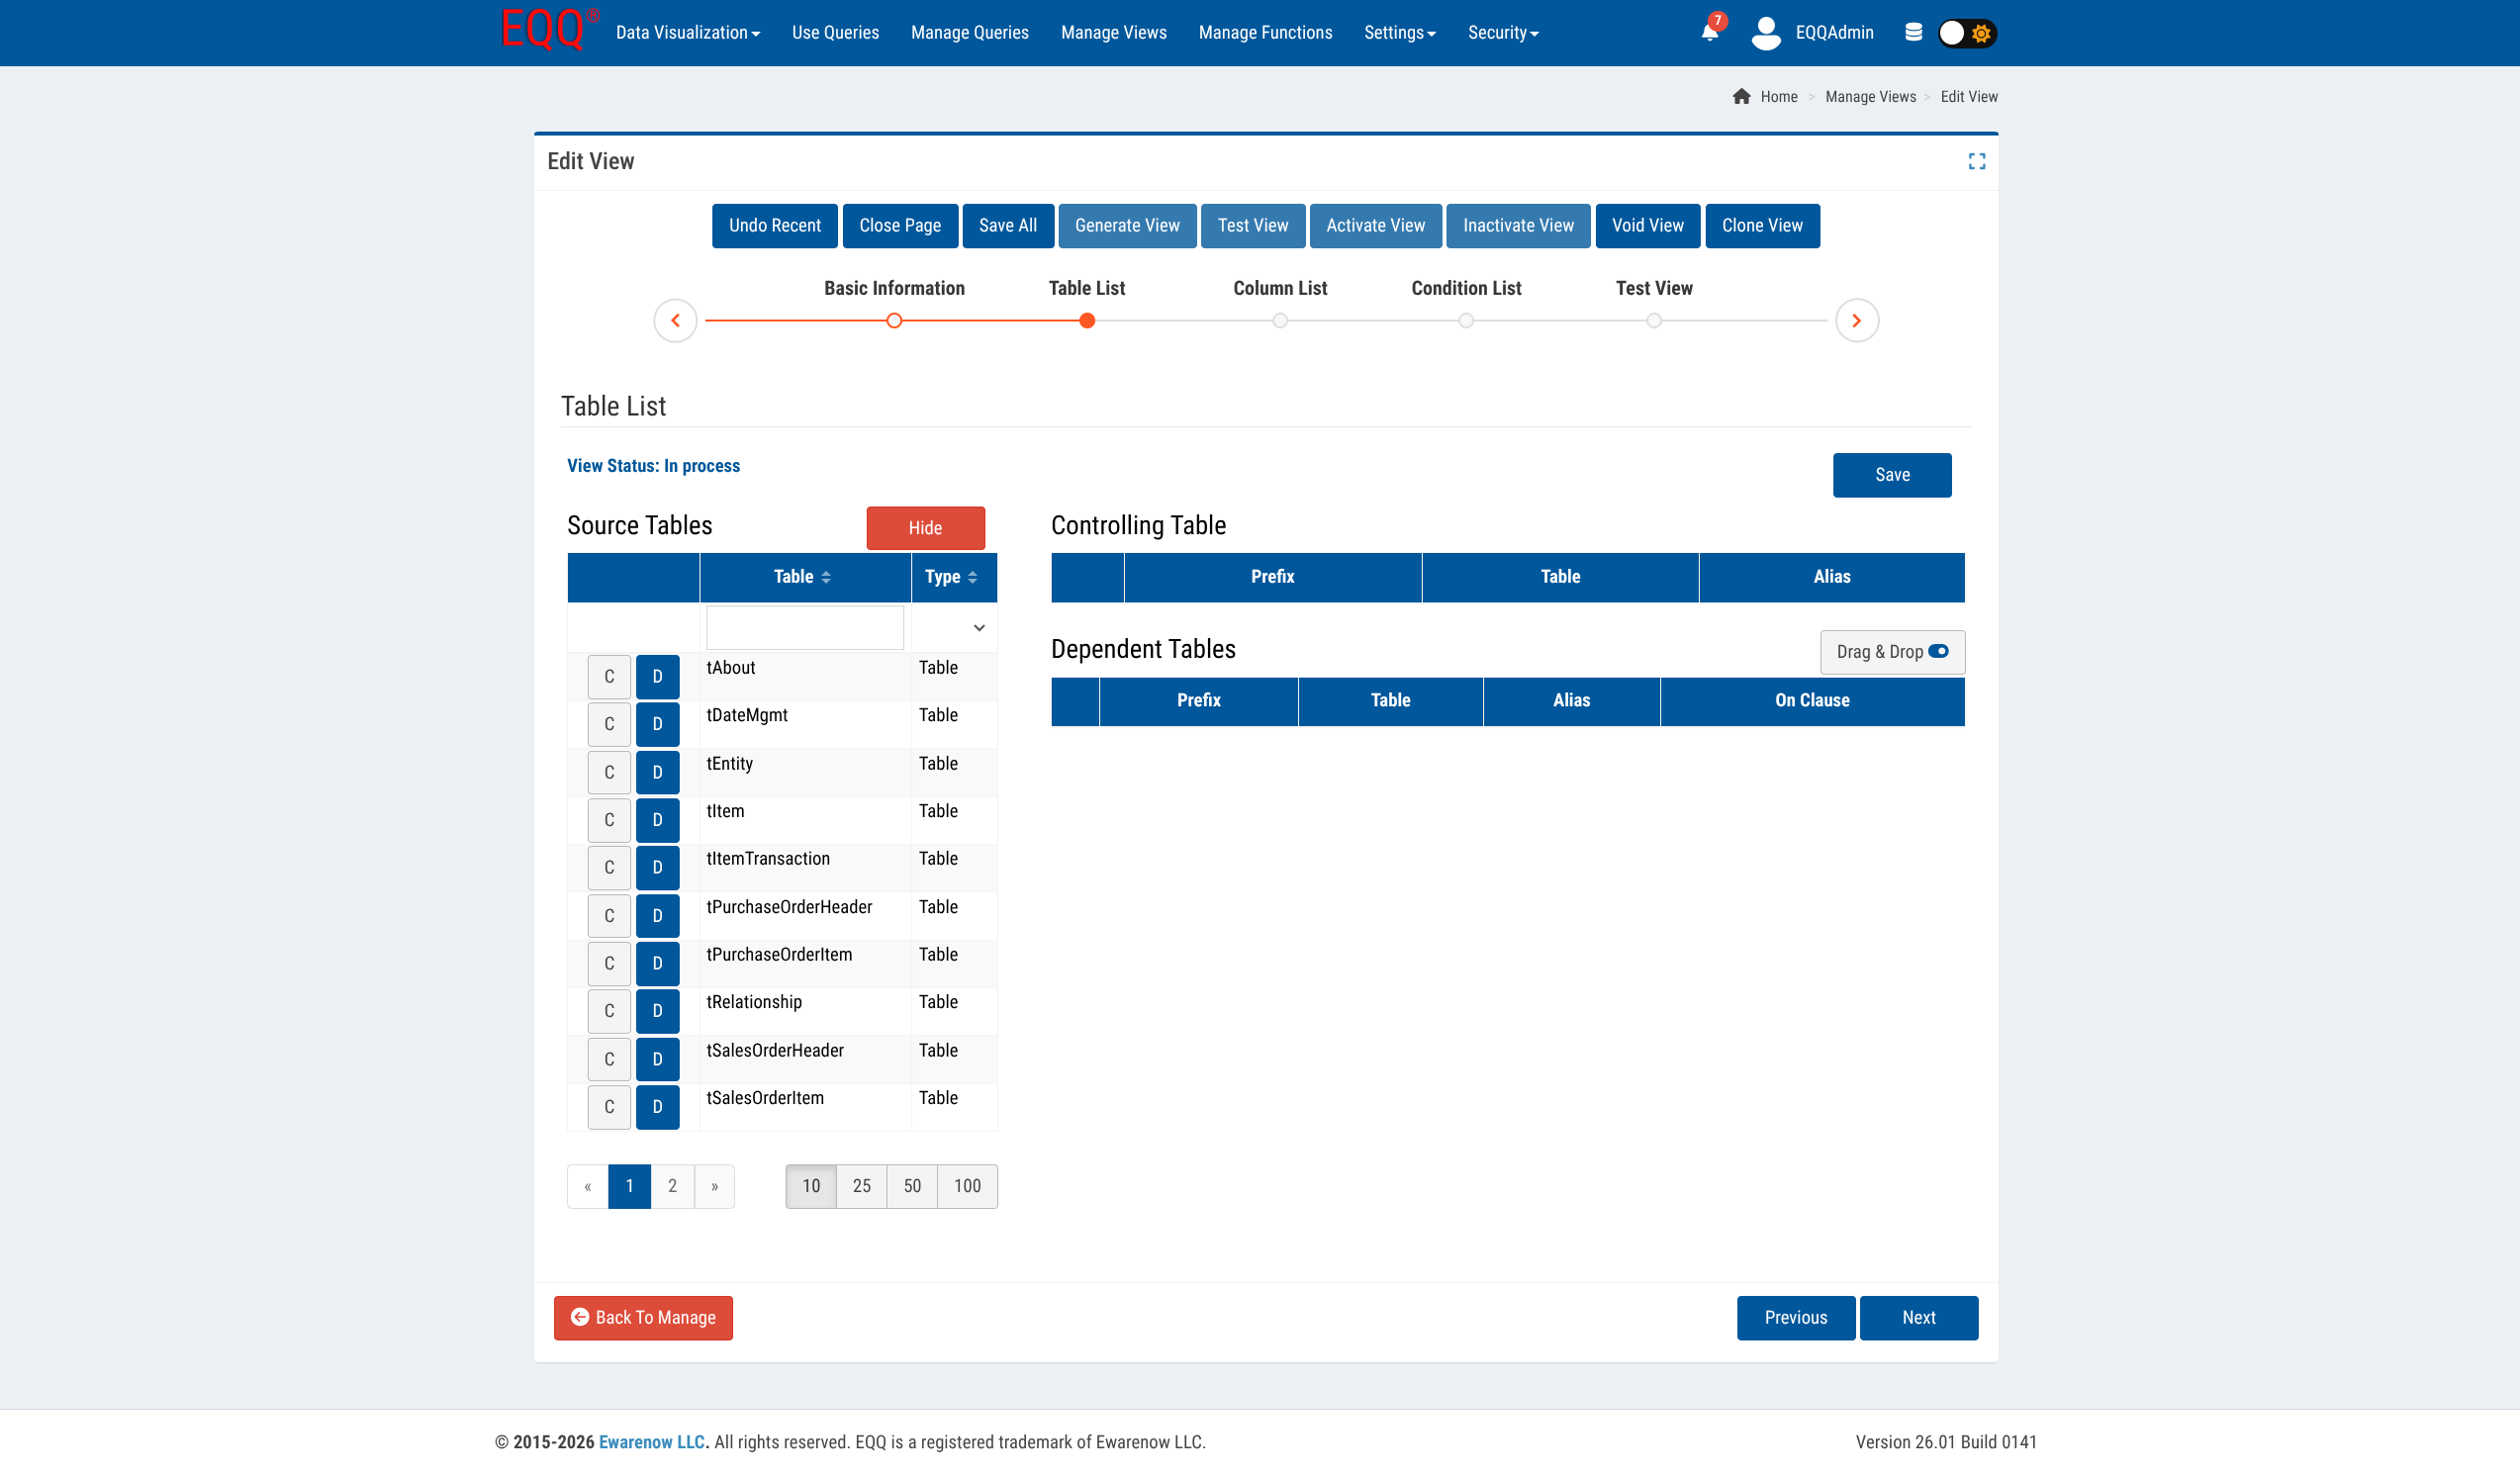
Pick exactly one Controlling Table (click the C icon next to it in Source Tables). Optionally add Dependent Tables (click D) and define their join (On Clause) in the Dependent Tables panel. This is where joins belong - never in the Query.
Step 3 - Column List
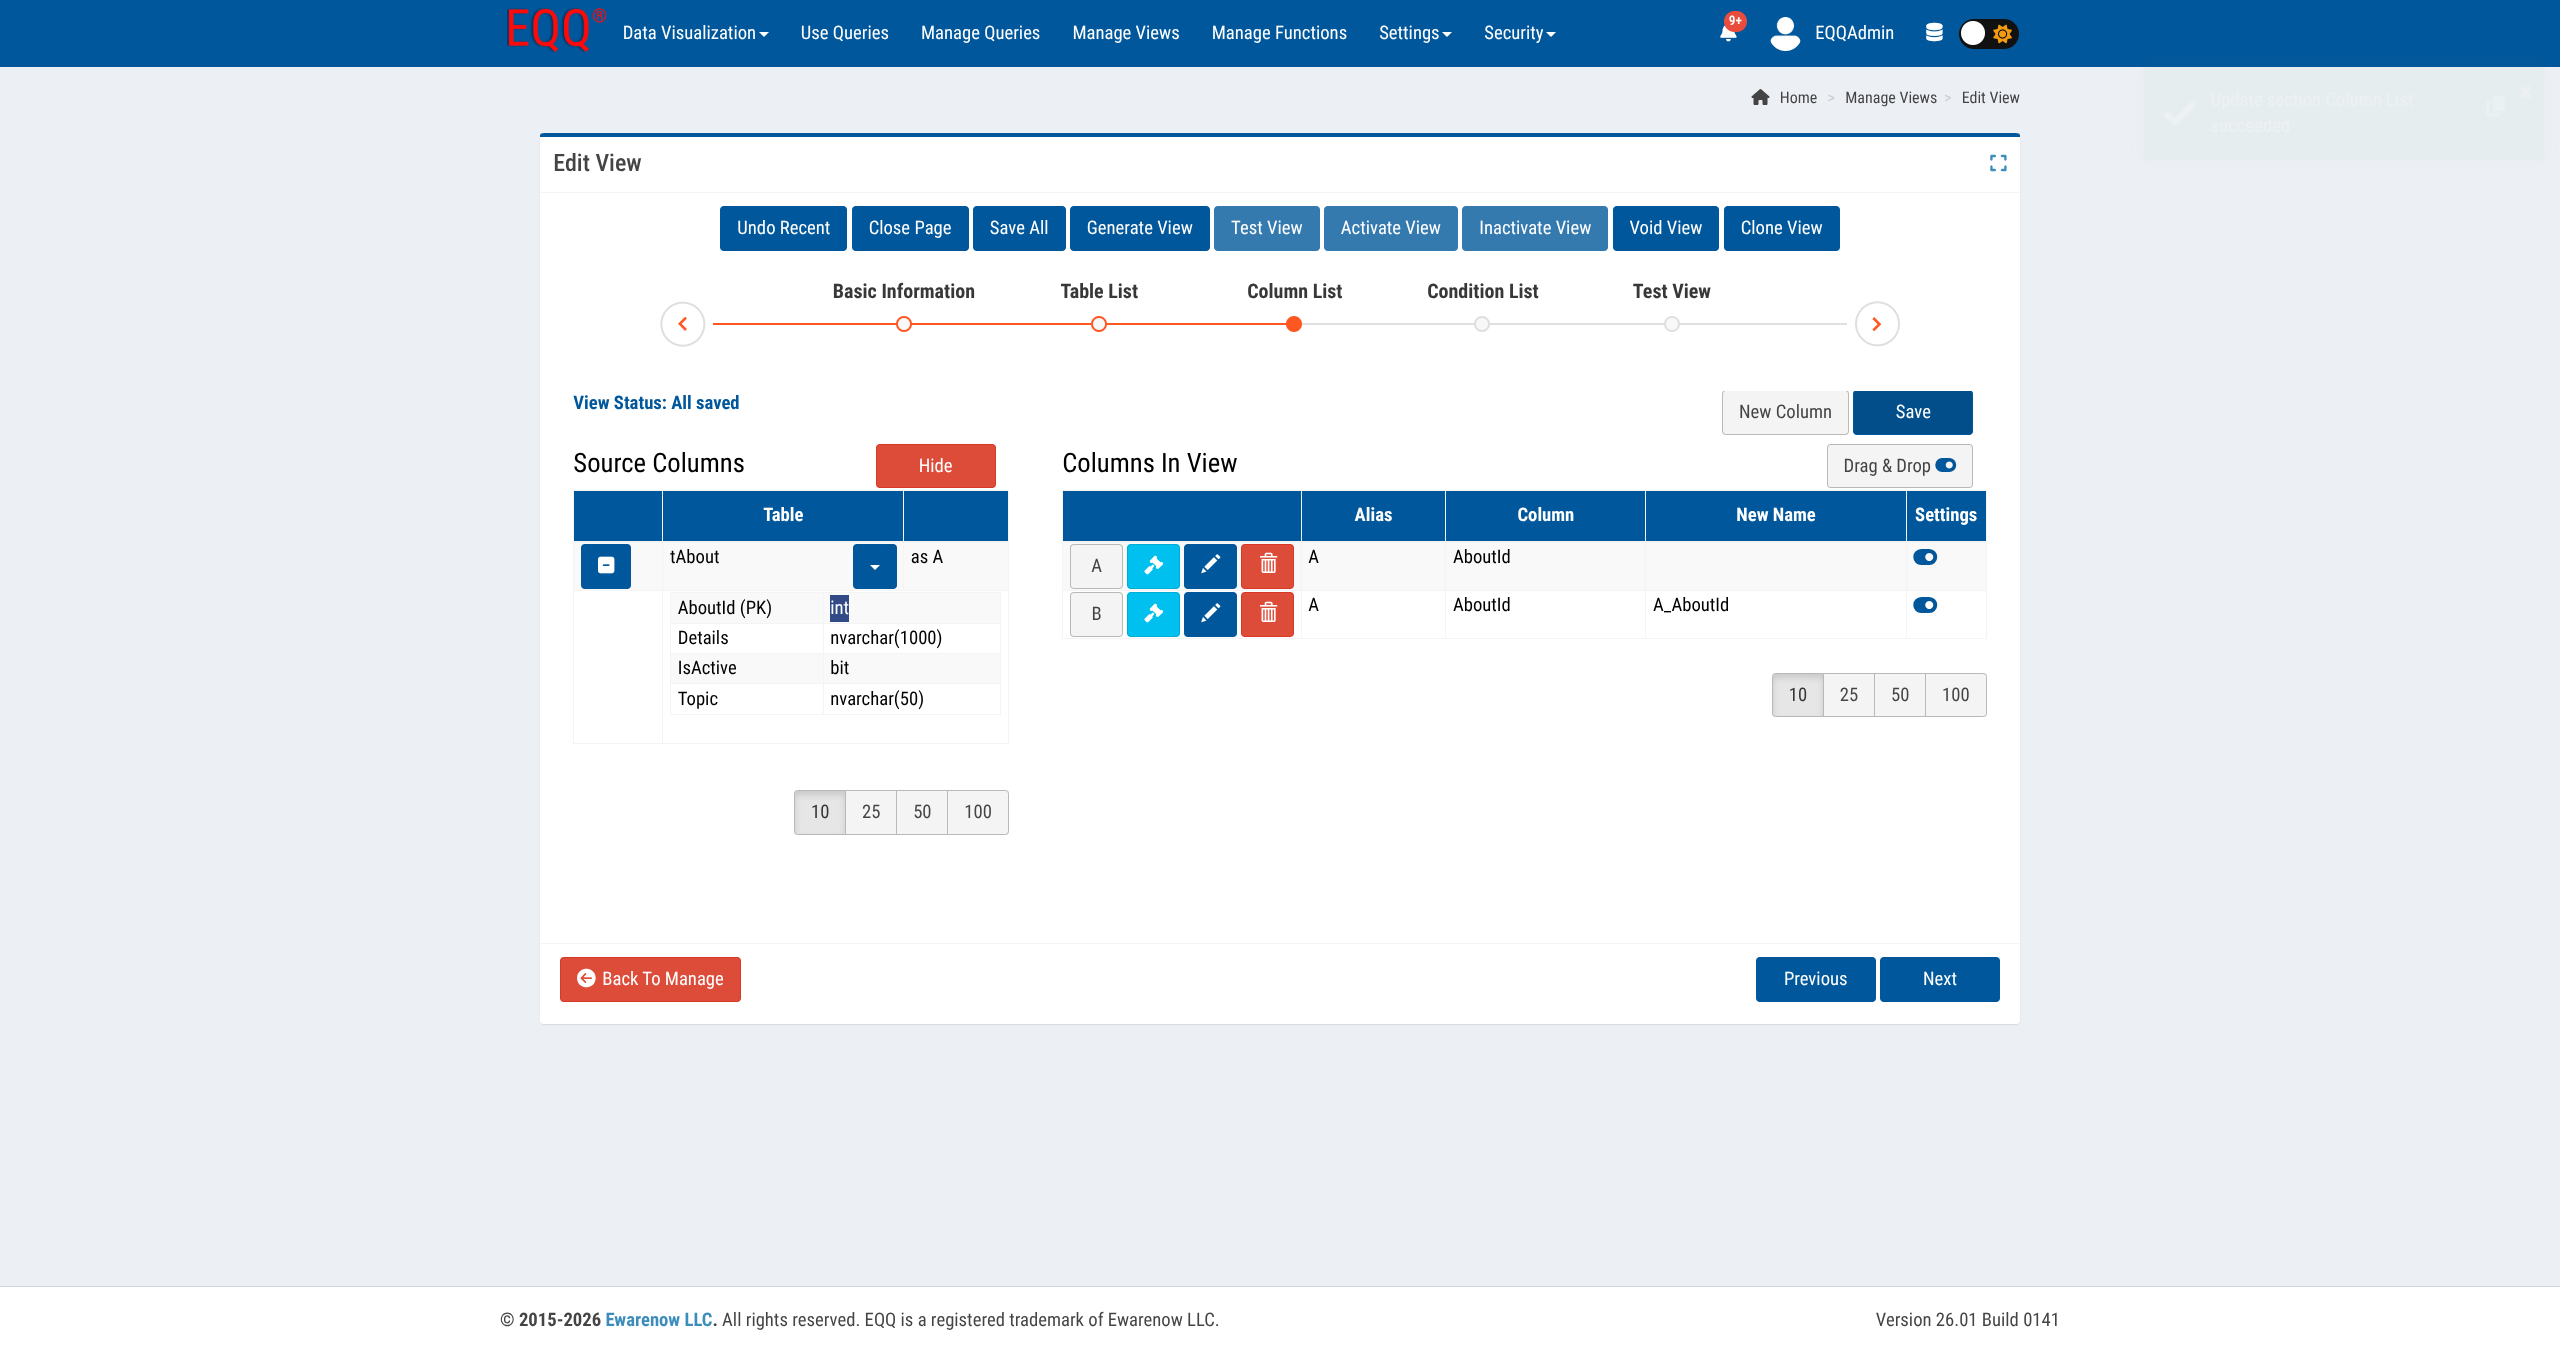
Drag columns from Source Columns into Columns in View. Click New Column to add a computed column. Two advanced toggles live here:
- Has Pivot - reshape row values into columns (spreadsheet-style pivot), computed at the View level.
- Has Grouping - aggregate rows (SUM/COUNT/etc.) at the View level rather than per-Query.
Both are advanced features - leave them off for a straightforward View.
Step 4 - Condition List
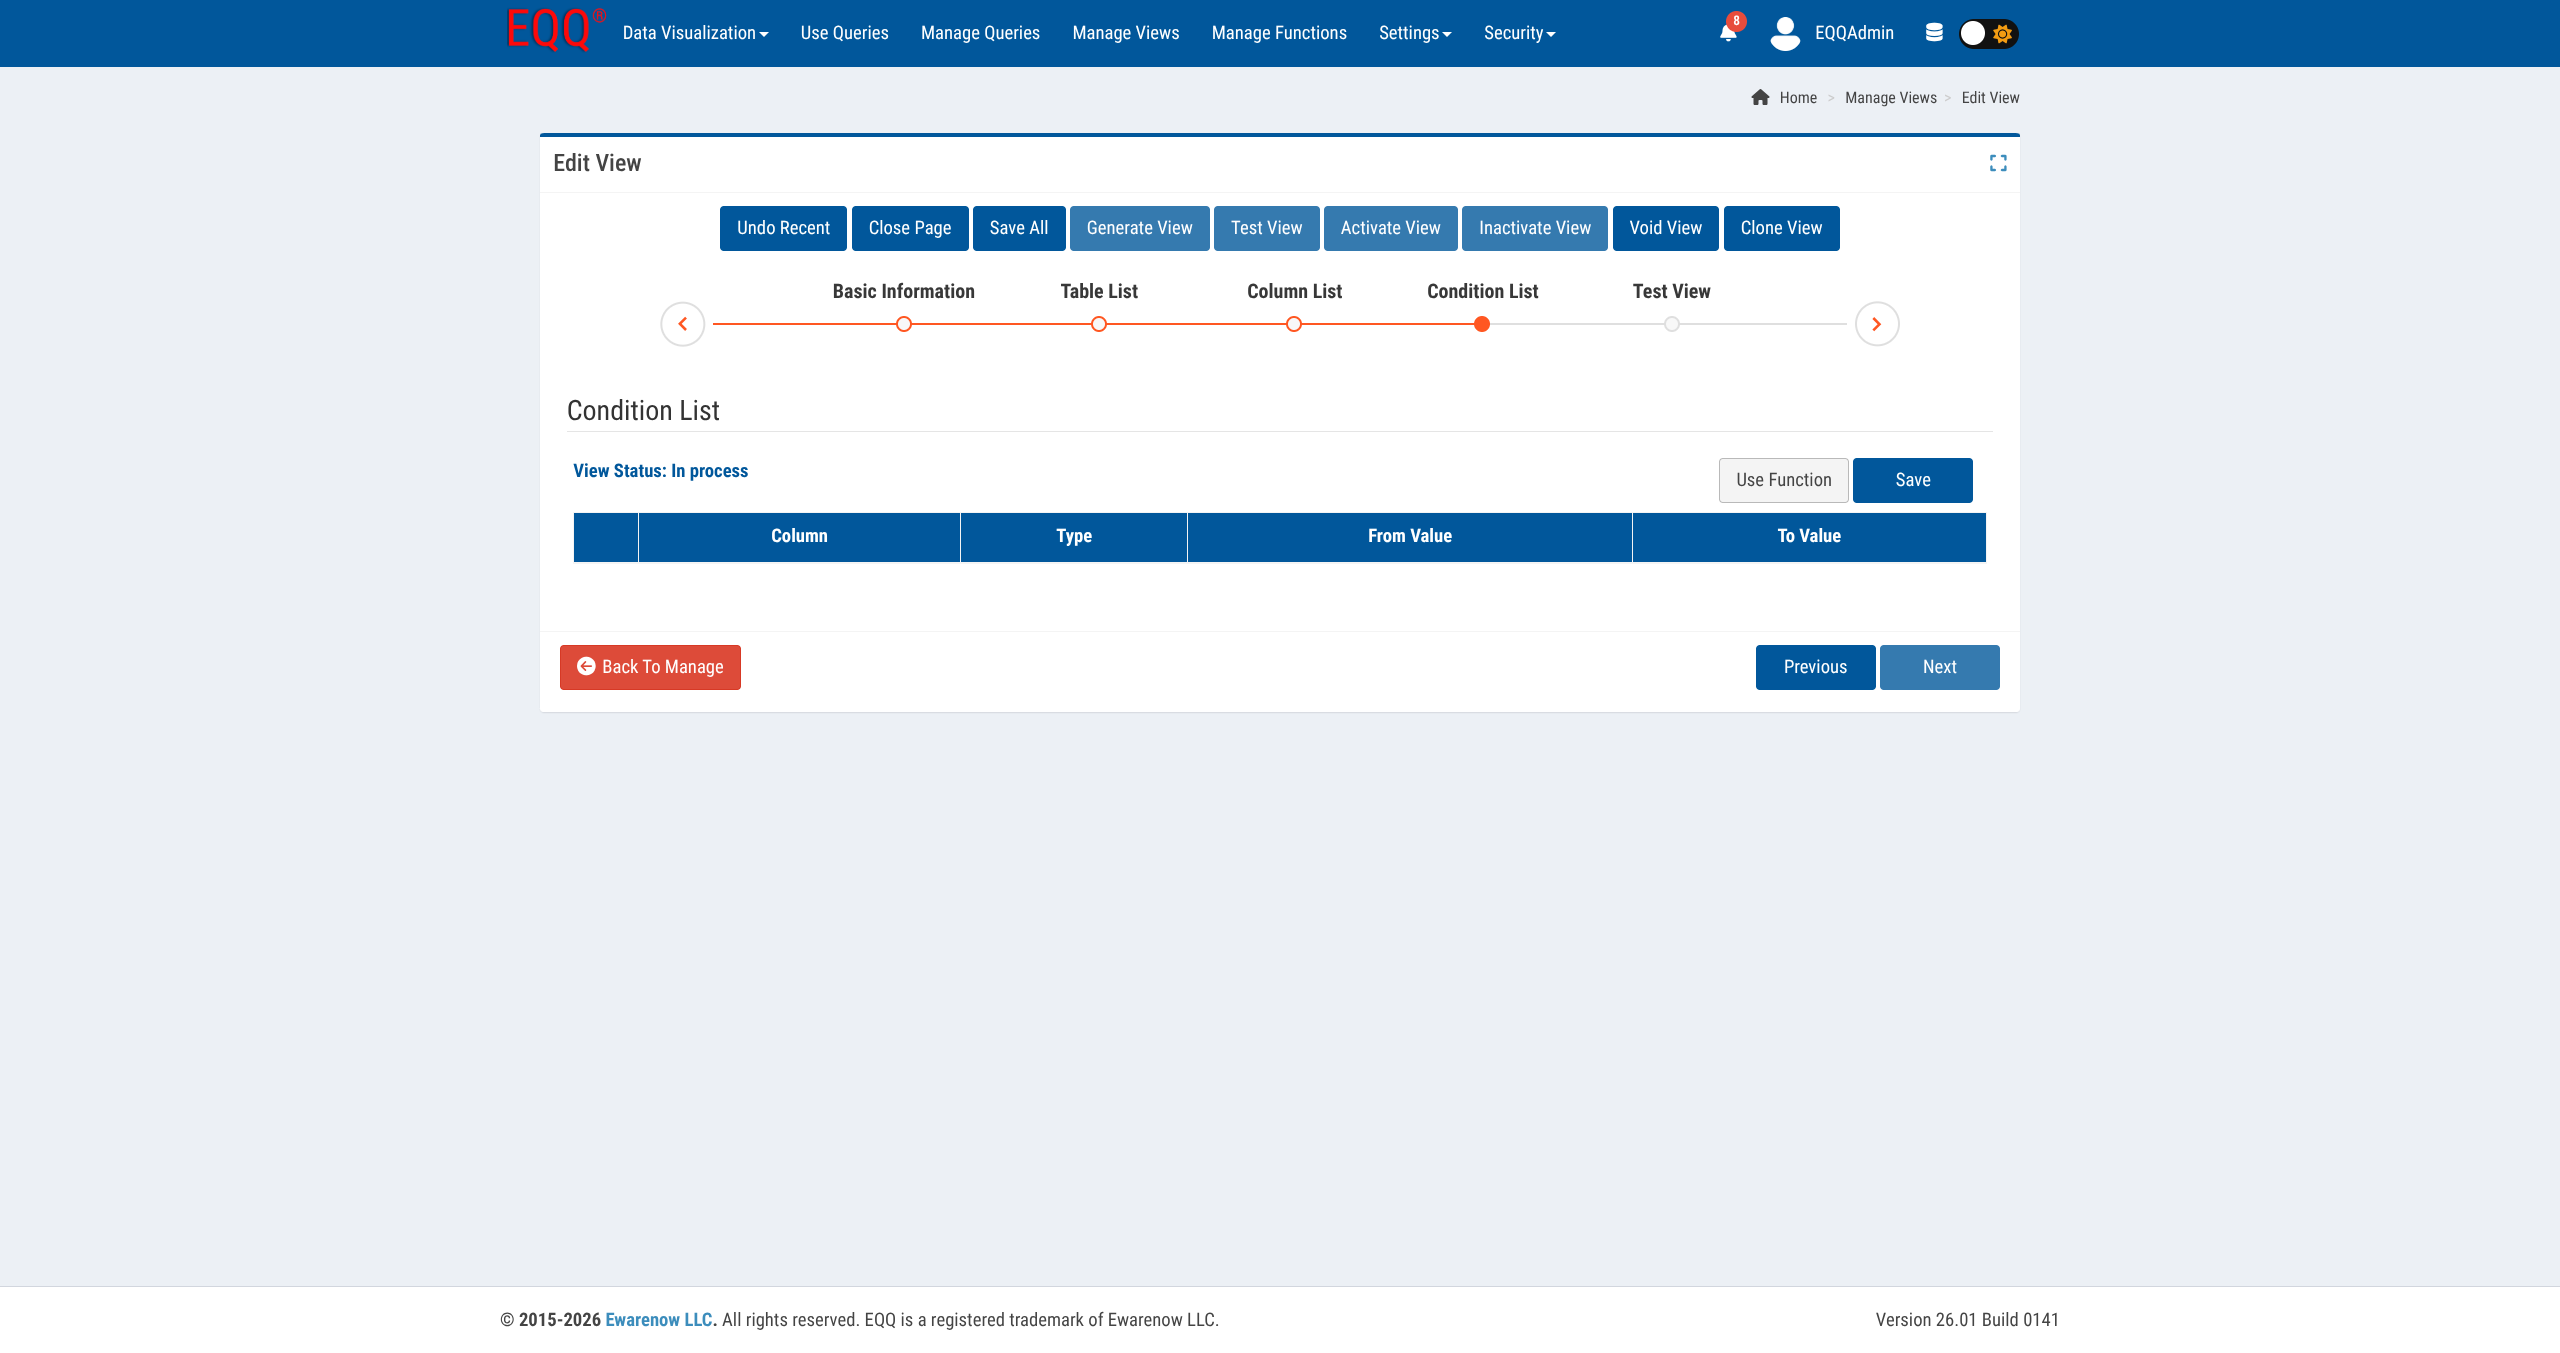
Add a fixed, always-applied filter (Column / Type / From Value / To Value) that every Query built on this View inherits. Optional - most Views don't need one.
Step 5 - Test View
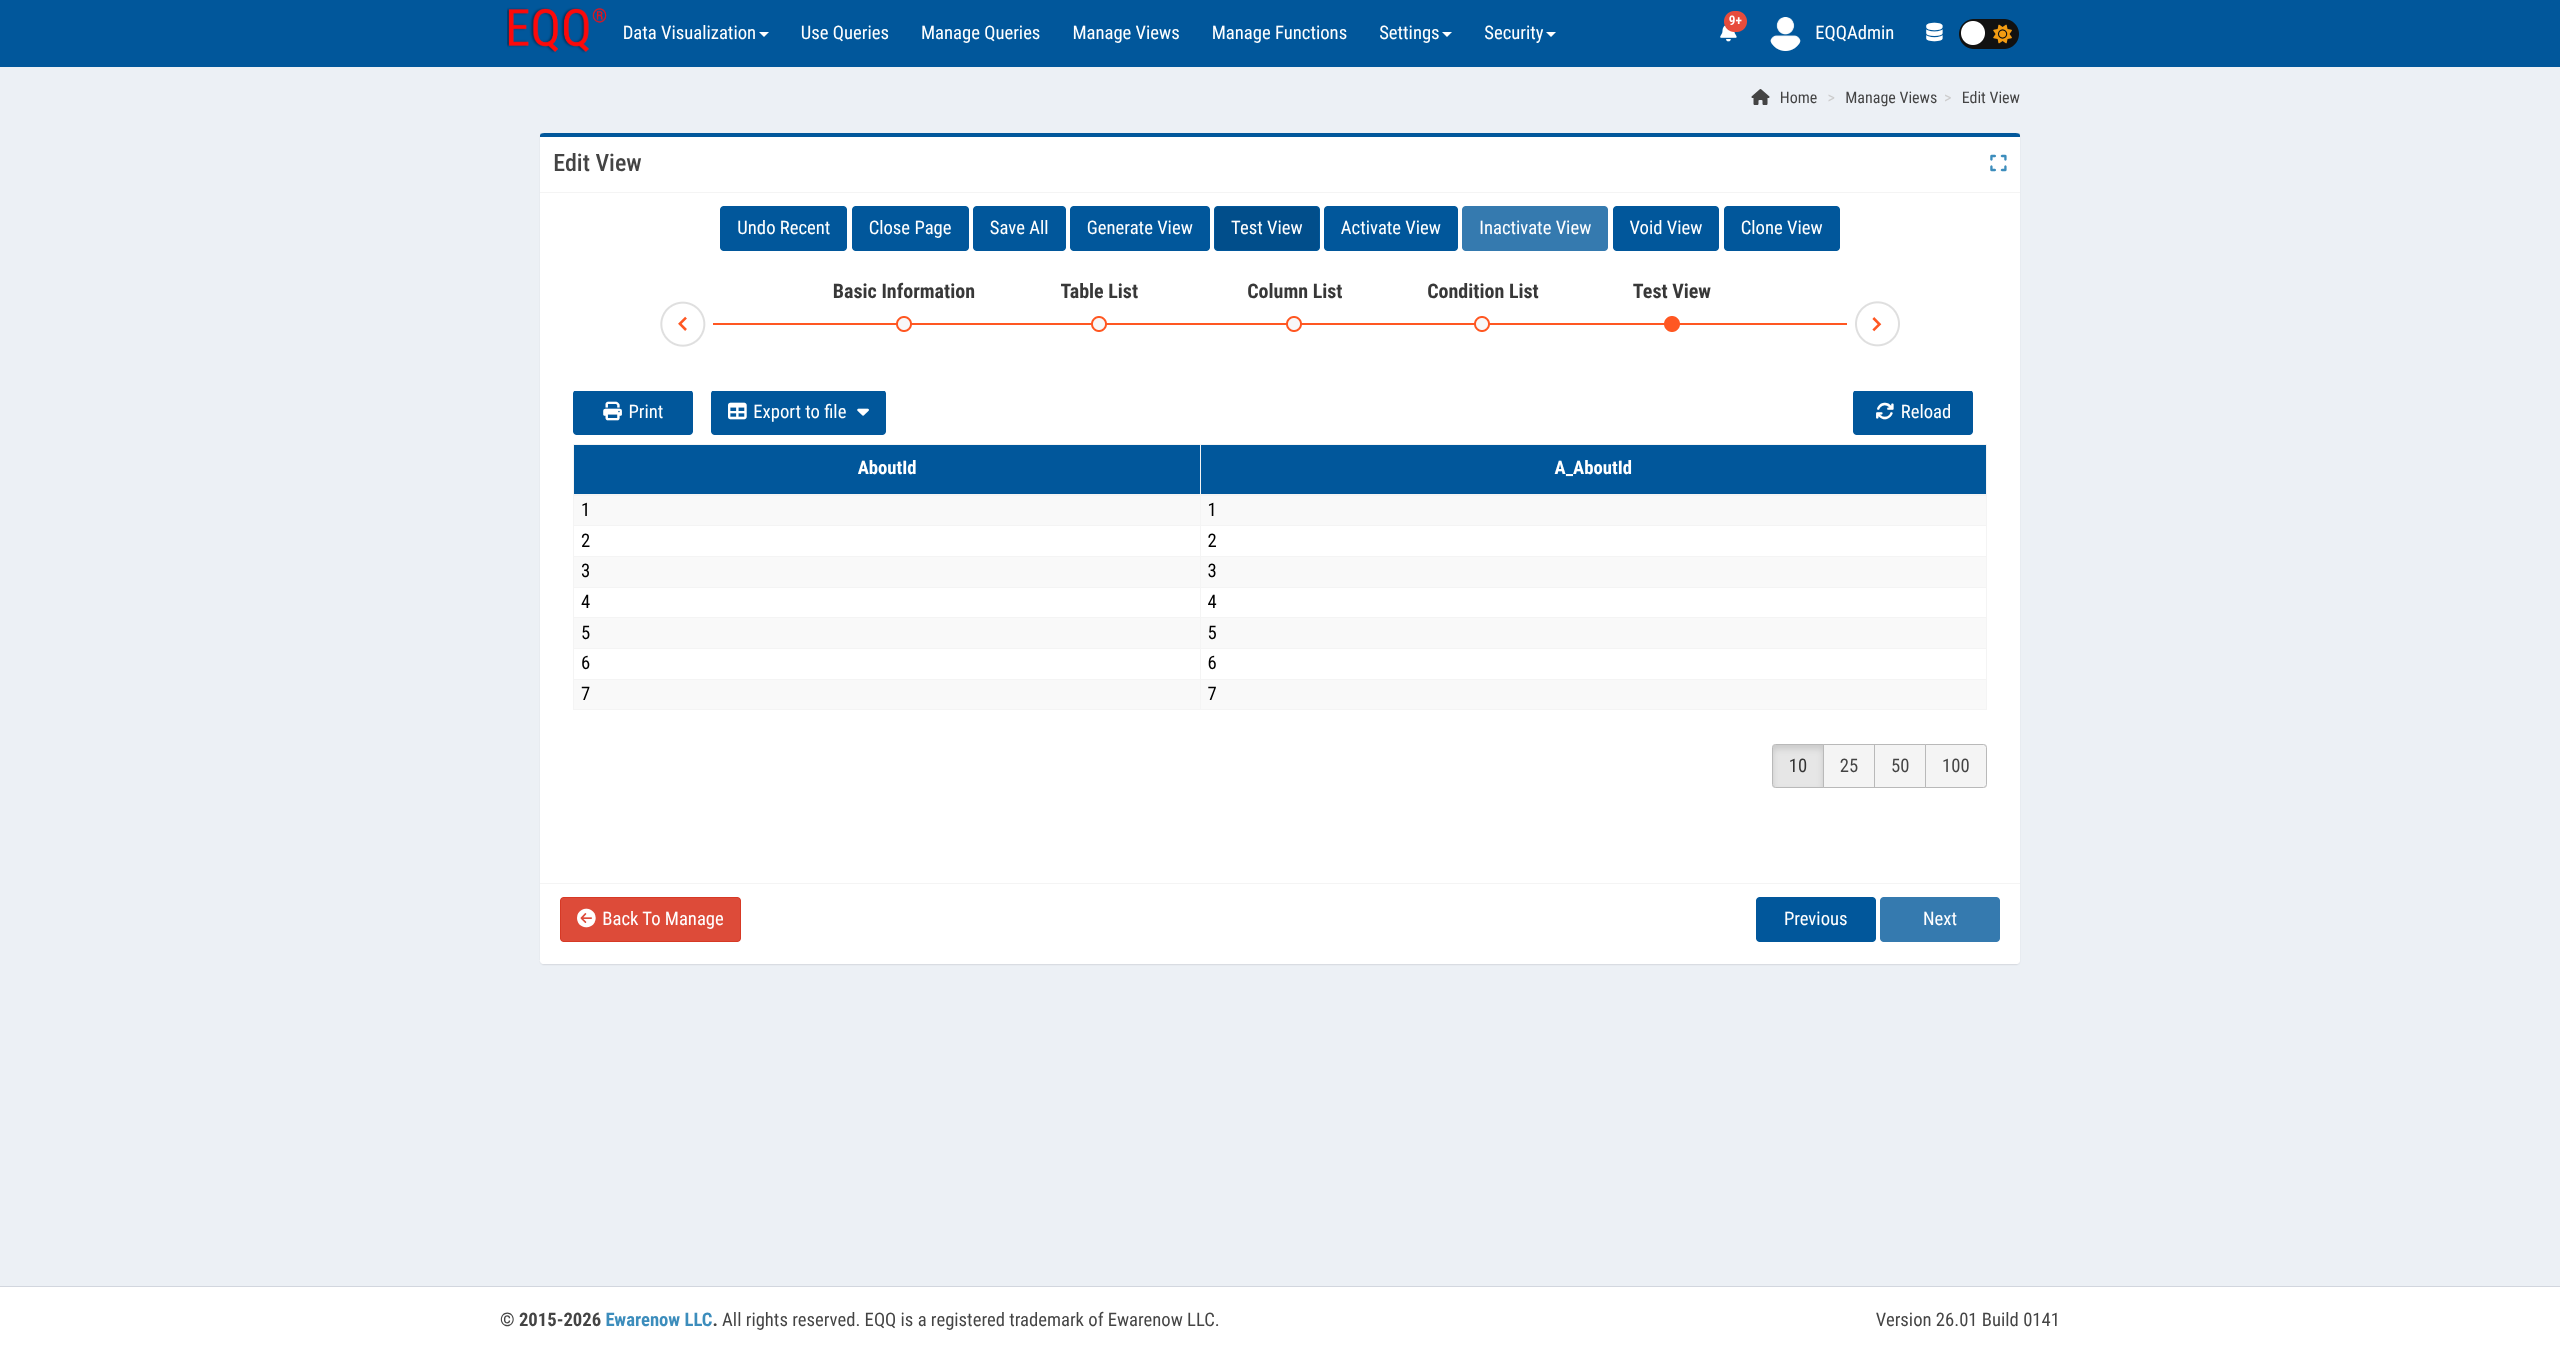
Click Reload to preview the View's output, with Print and Export to file available. When it looks right, use the top toolbar: Generate View, then Activate View. A View must be Active before any Query can use it.
Manage Queries
Navigate: top bar → Manage Queries.
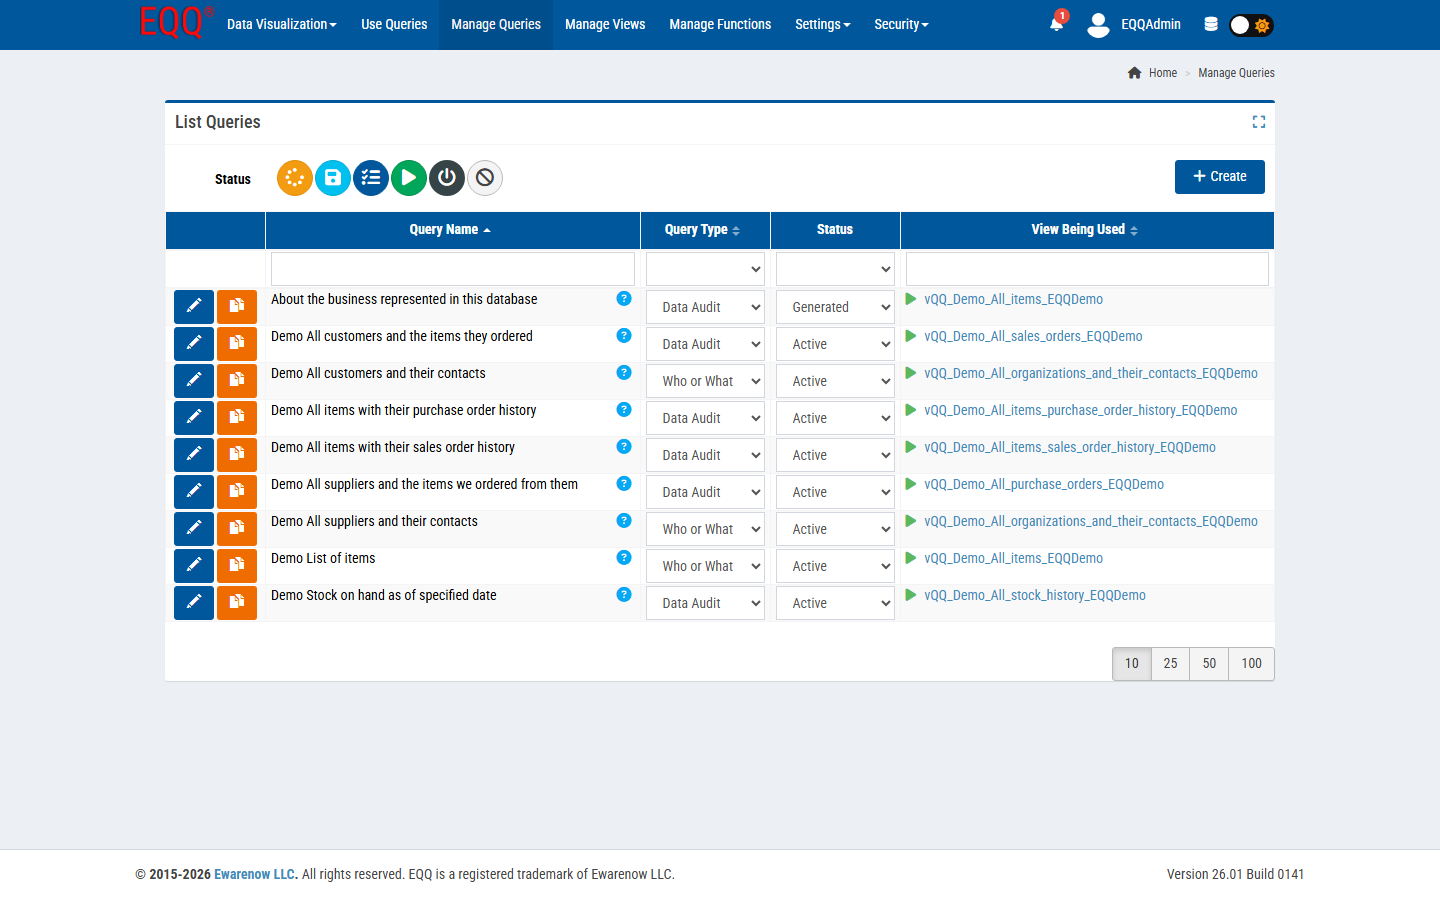
Same shape as Manage Views, with an extra column View Being Used - the underlying View this Query reads from. Clicking the View name jumps to its definition.
Toolbar: Status filter row (six icons, one per lifecycle state) and + Create, which opens the Query editor.
The Query editor
A 7-step wizard: Basic Information → Column List → Condition List → Parameter List → Sort By List → Epilogue → Test Query. Use Previous / Next at the bottom, or click a step label directly. The same toolbar as the View wizard is always visible: Undo Recent / Close Page / Save All / Generate Query / Test Query / Activate Query / Inactivate Query / Void Query / Clone Query.
Step 1 - Basic Information
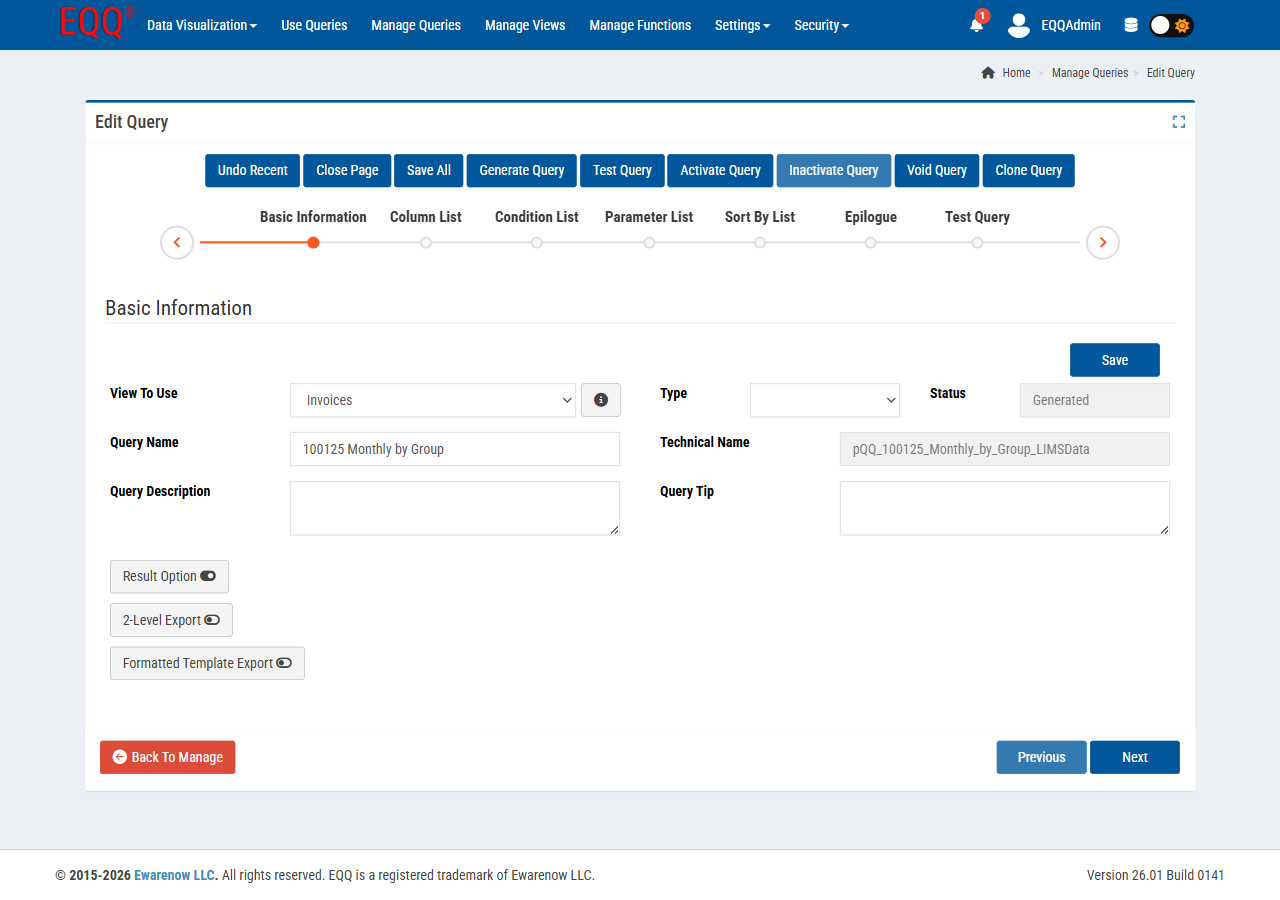
| Field | Purpose |
|---|---|
| View To Use | The single View this Query reads from. Required. |
| Query Type | Category (from Settings → Query Type) - drives discovery in Use Queries. |
| Query Name | Friendly name shown to end users. |
| Technical Name | Auto-suggested, read-only, unique per database. |
| Query Description | End-user-facing - appears in the Use Queries list. |
| Query Tip | Hover tip shown in Use Queries and at parameter prompts. |
Three additional toggles appear on this step, independent of the fields above:
- Result Option - advanced result-delivery settings beyond the default grid/export.
- 2-Level Export - group export rows under a parent/child structure (shipped since Build 0121, per the release notes).
- Formatted Template Export - export using a predefined formatted template rather than a raw grid (shipped since Build 0126).
Step 2 - Column List
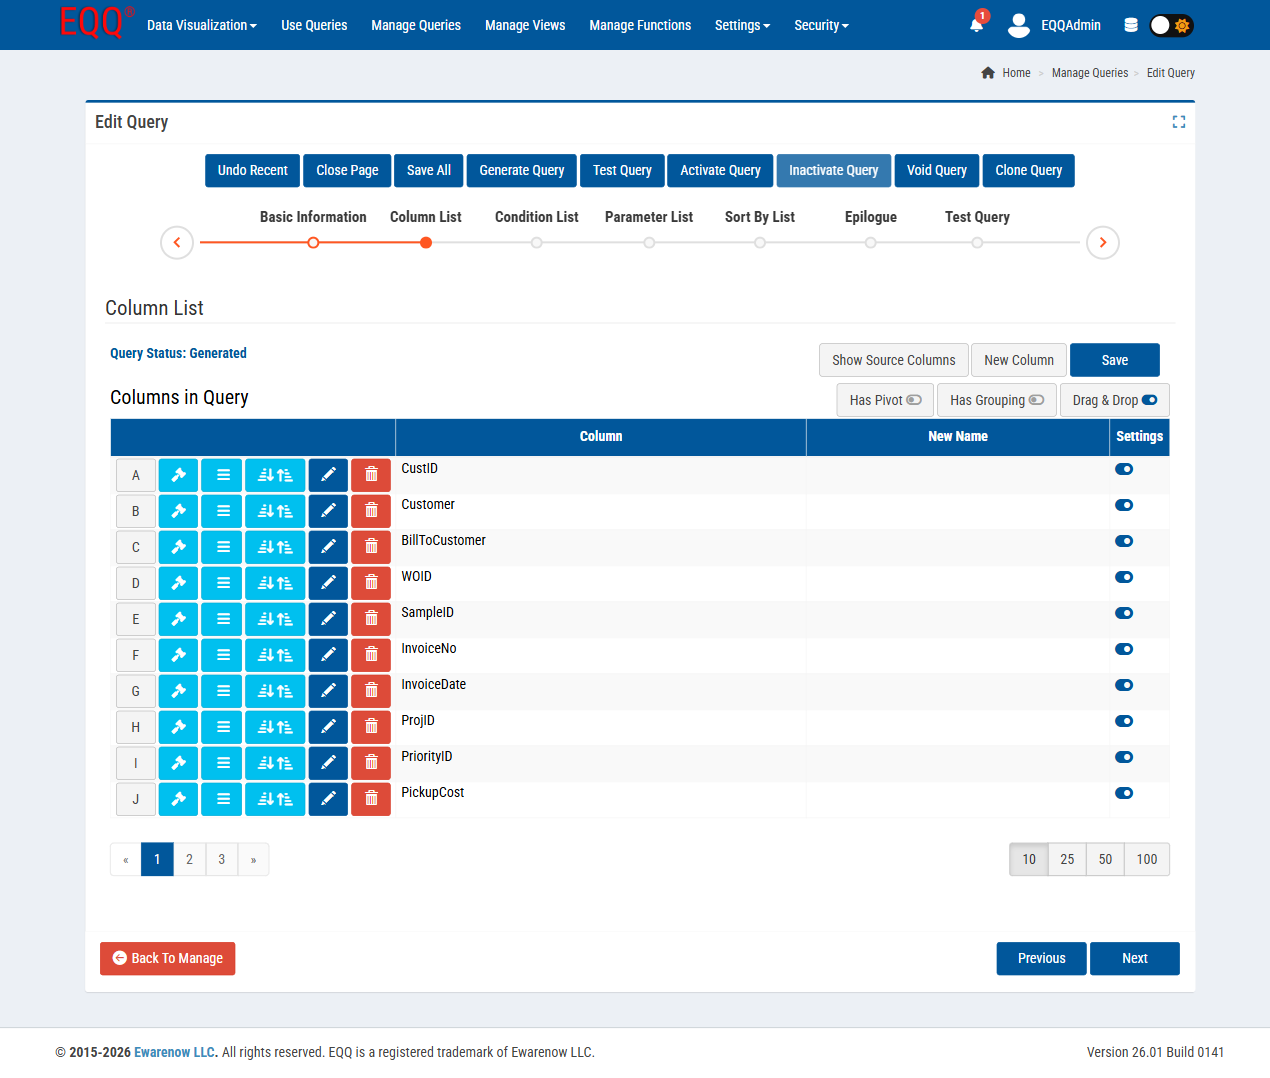
Check the columns to return; drag to reorder; set a New Name to rename for end users. Each column also has quick-add icons that send it straight to the Fixed Condition List, Parameter List, or Sort By List without leaving this step - a shortcut for the steps below.
Step 3 - Condition List
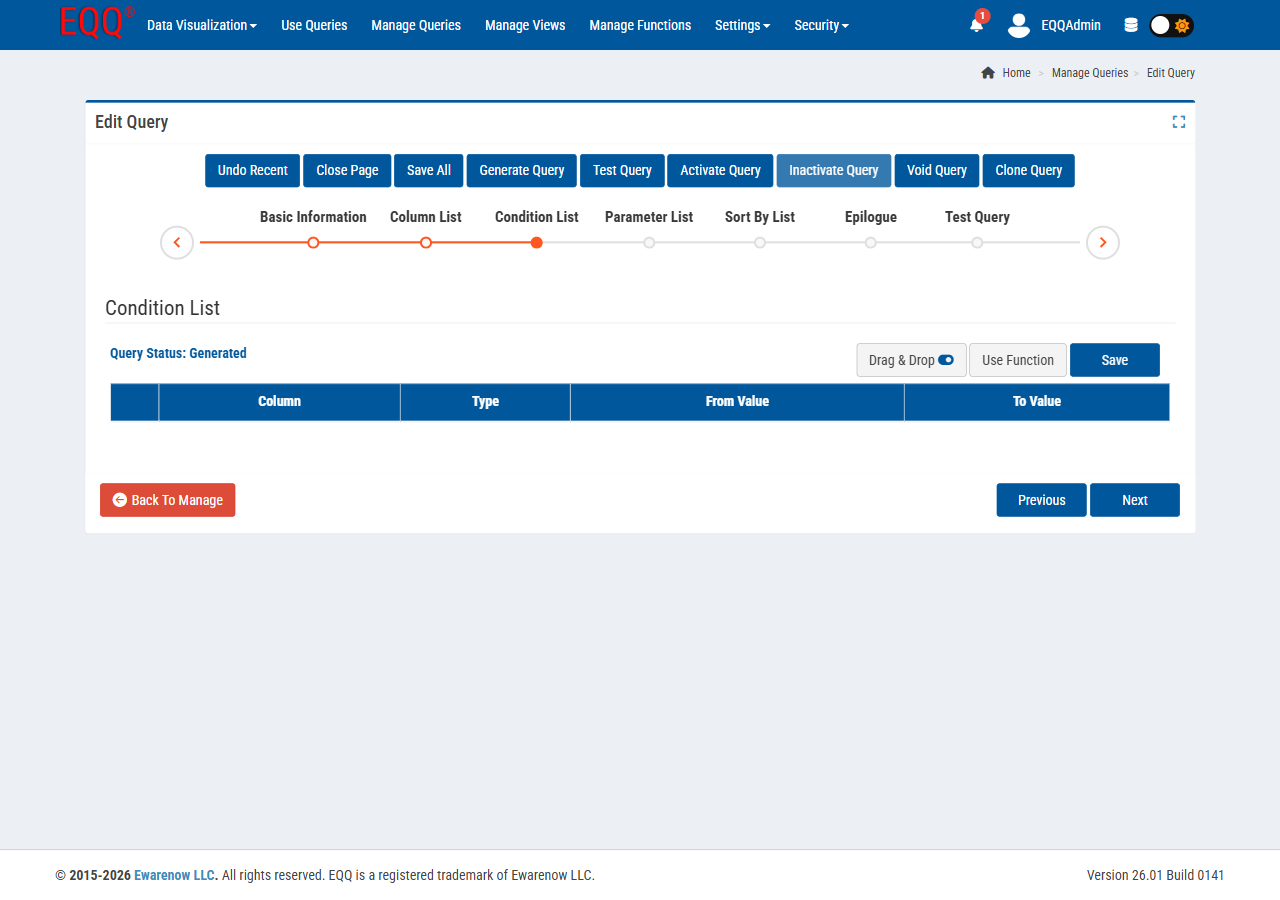
Build a fixed WHERE-clause row per condition: Column, Type (operator), From Value, To Value. Add a Use Function row to filter using an fQQ_* function's result. Combine rows using AND/OR grouping - confirmed with a single-condition example only; if you build a multi-condition query, the grouping control's exact placement may differ from what's described here.
Step 4 - Parameter List
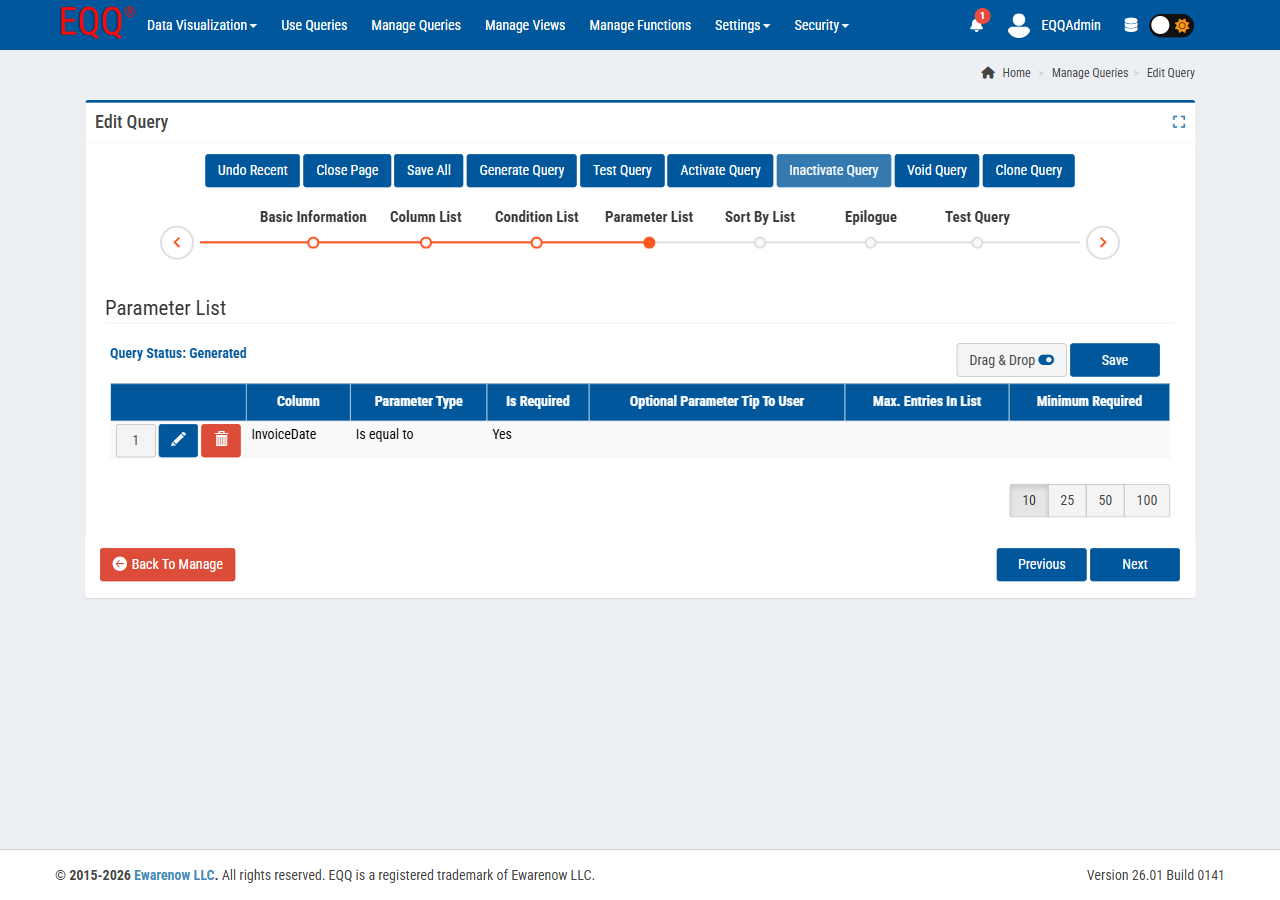
Declare runtime inputs: Column, Parameter Type, Is Required, Optional Parameter Tip To User, Max. Entries In List (for list-type parameters), Minimum Required. Mark as required to keep the Run button disabled until a value is supplied.
Step 5 - Sort By List
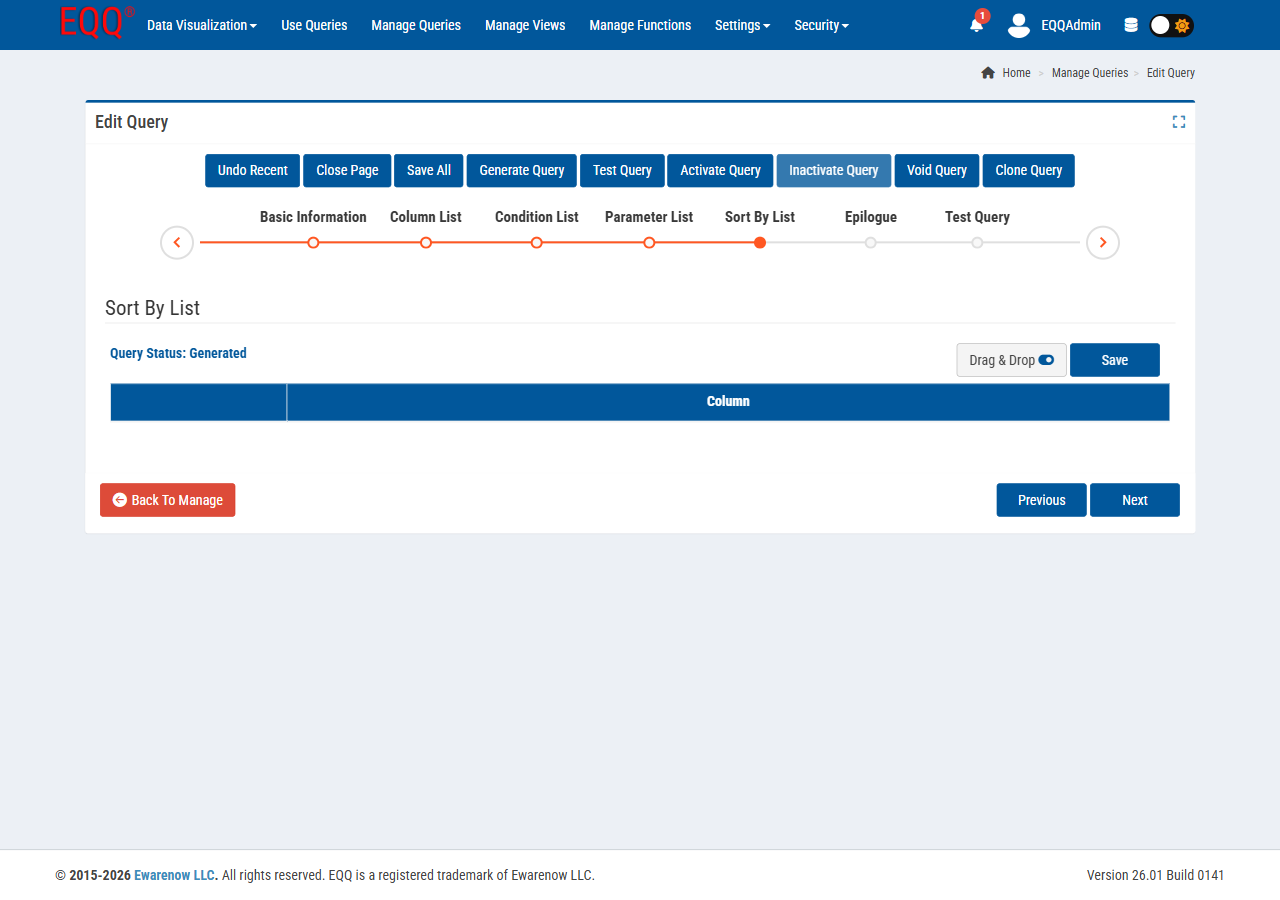
Set default column ordering (ascending/descending, via the icon next to each row). Users can still re-sort interactively in the result grid.
Step 6 - Epilogue
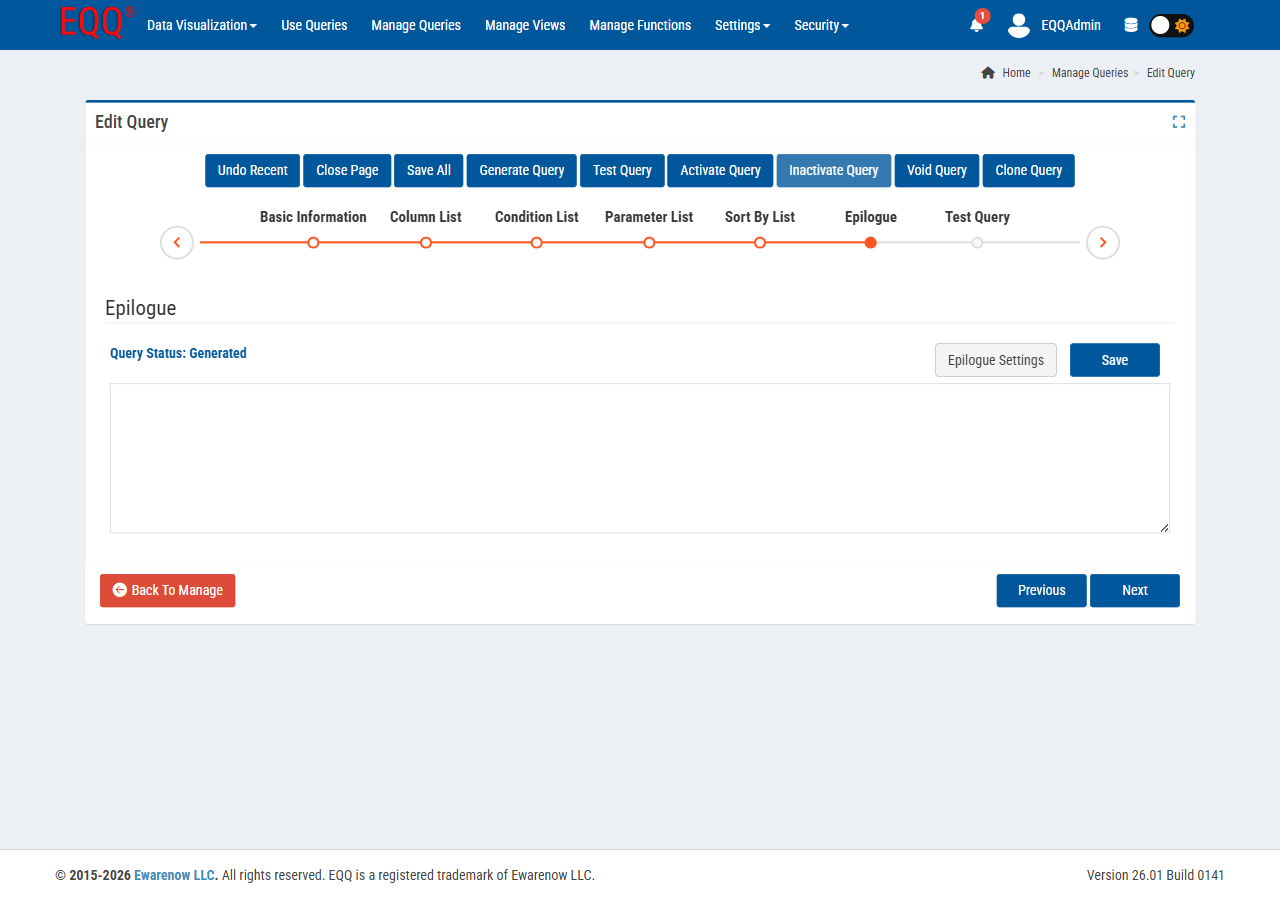
Optional SQL that runs immediately after the main SELECT, inside the same transaction (audit inserts, flag updates). A Connect to Your App button appears alongside the SQL editor here - its exact behavior hasn't been confirmed live yet; don't document a specific claim about it until it has been. Epilogue access is gated by the Use Query Epilogue license flag - check Administration → License Manager if this step appears disabled.
Step 7 - Test Query
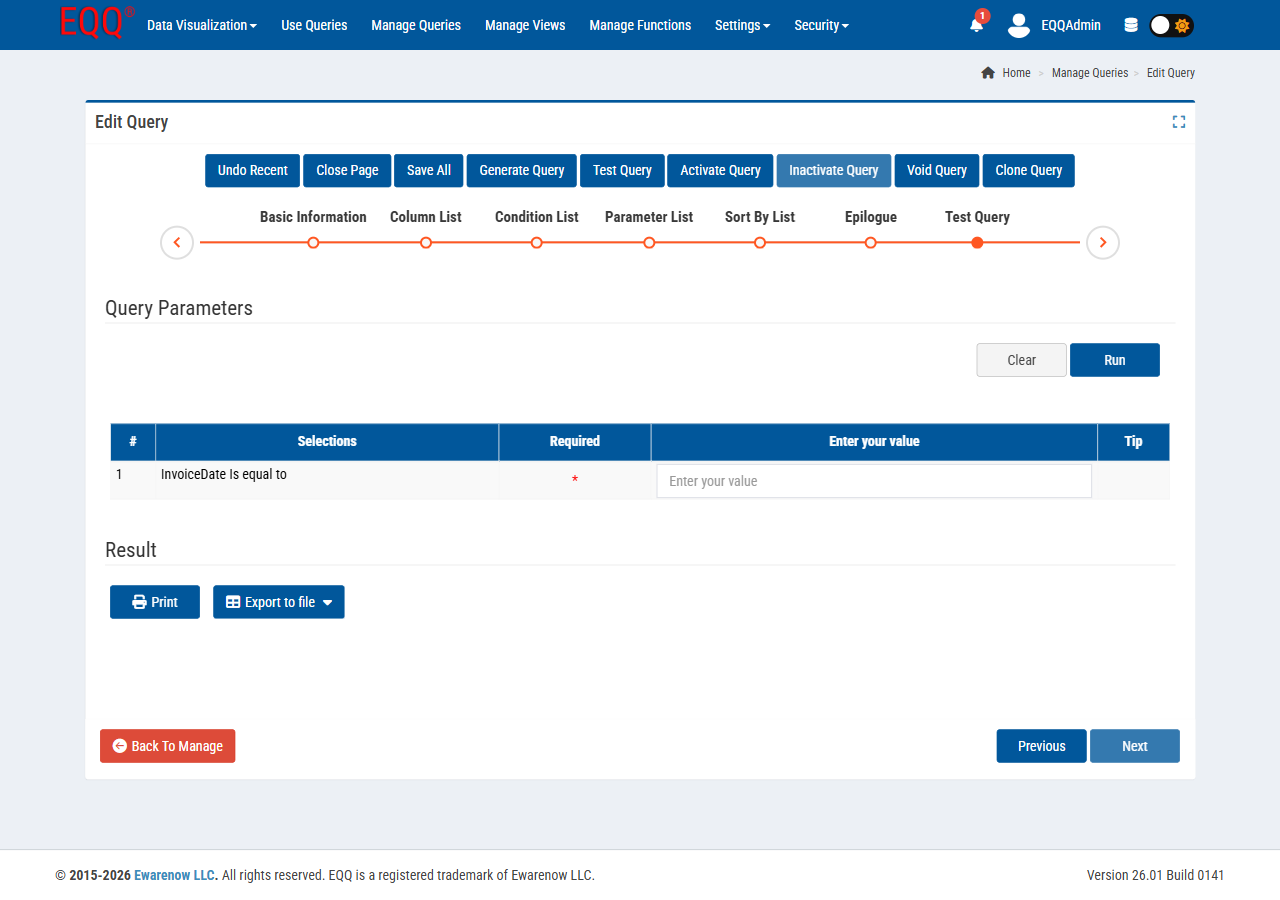
Enter sample parameter values and run to preview results before activating.
Running a Query
Navigate: top bar → Use Queries.
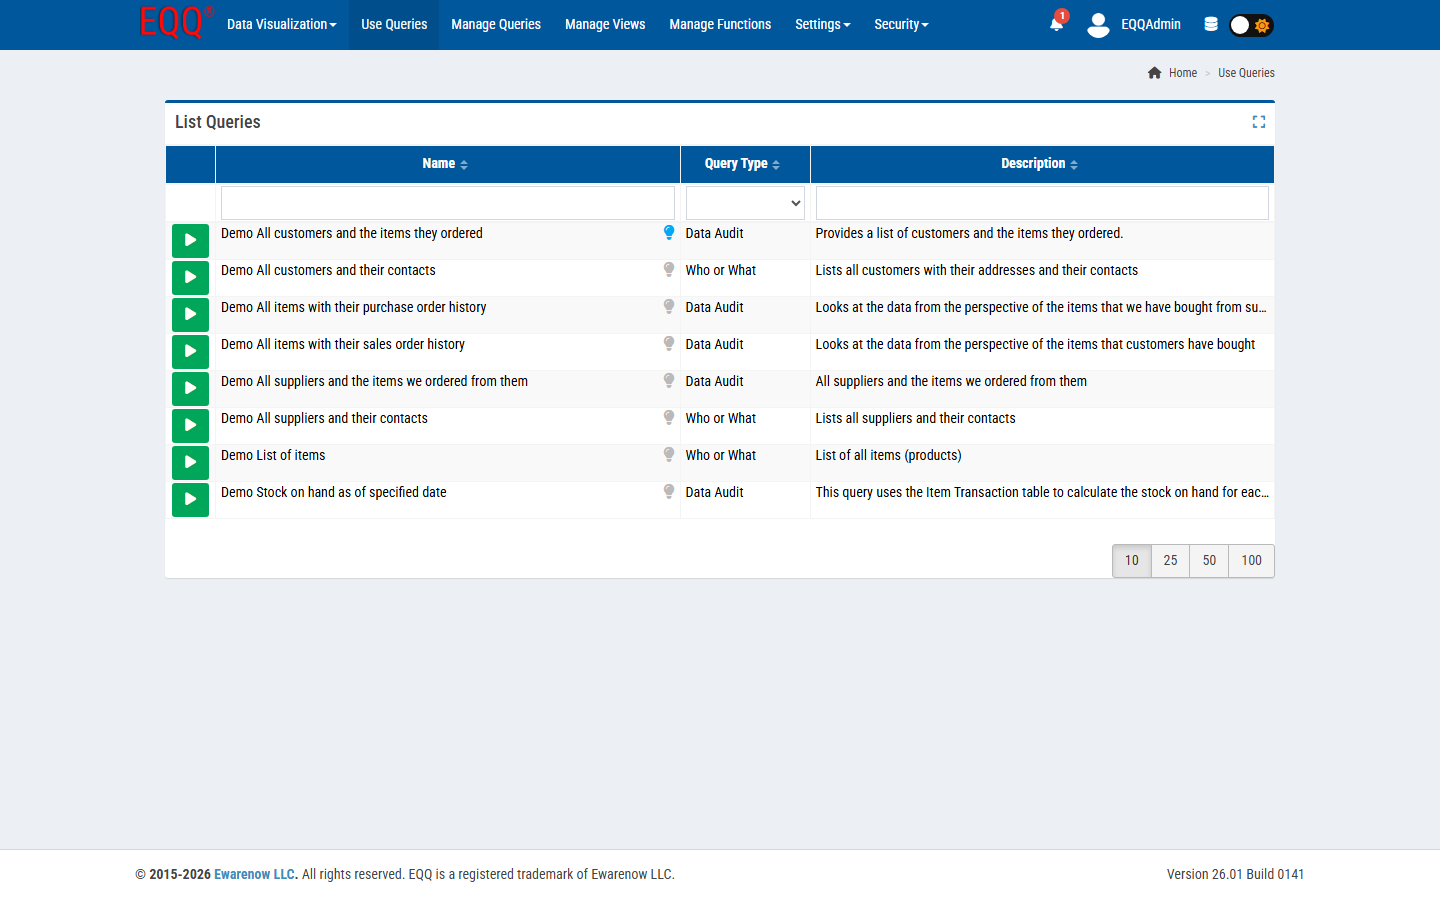
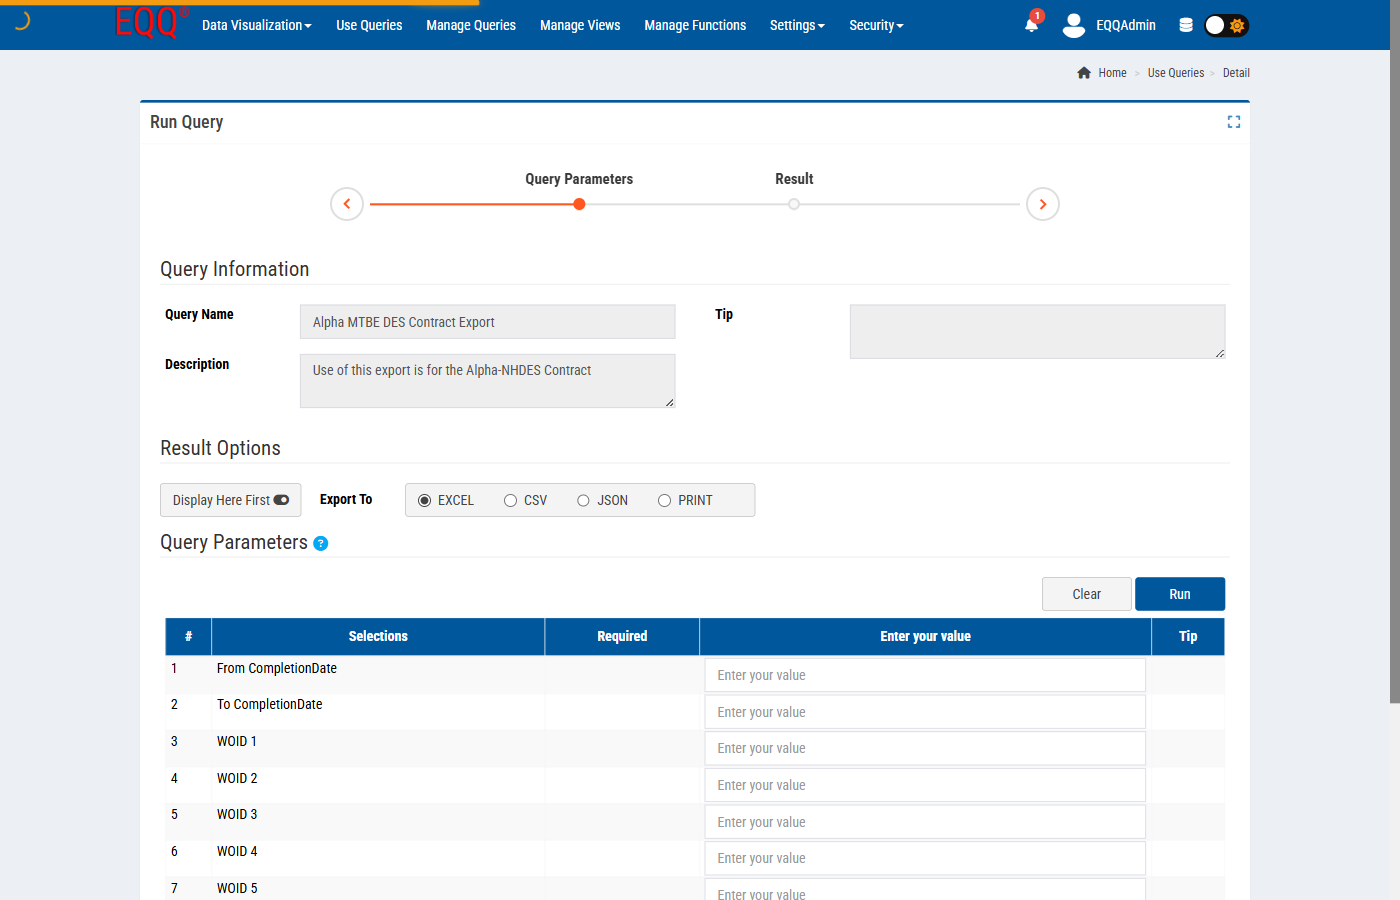
Only Active queries visible to your role and database appear here. Click the green ▶ to open Run Query:
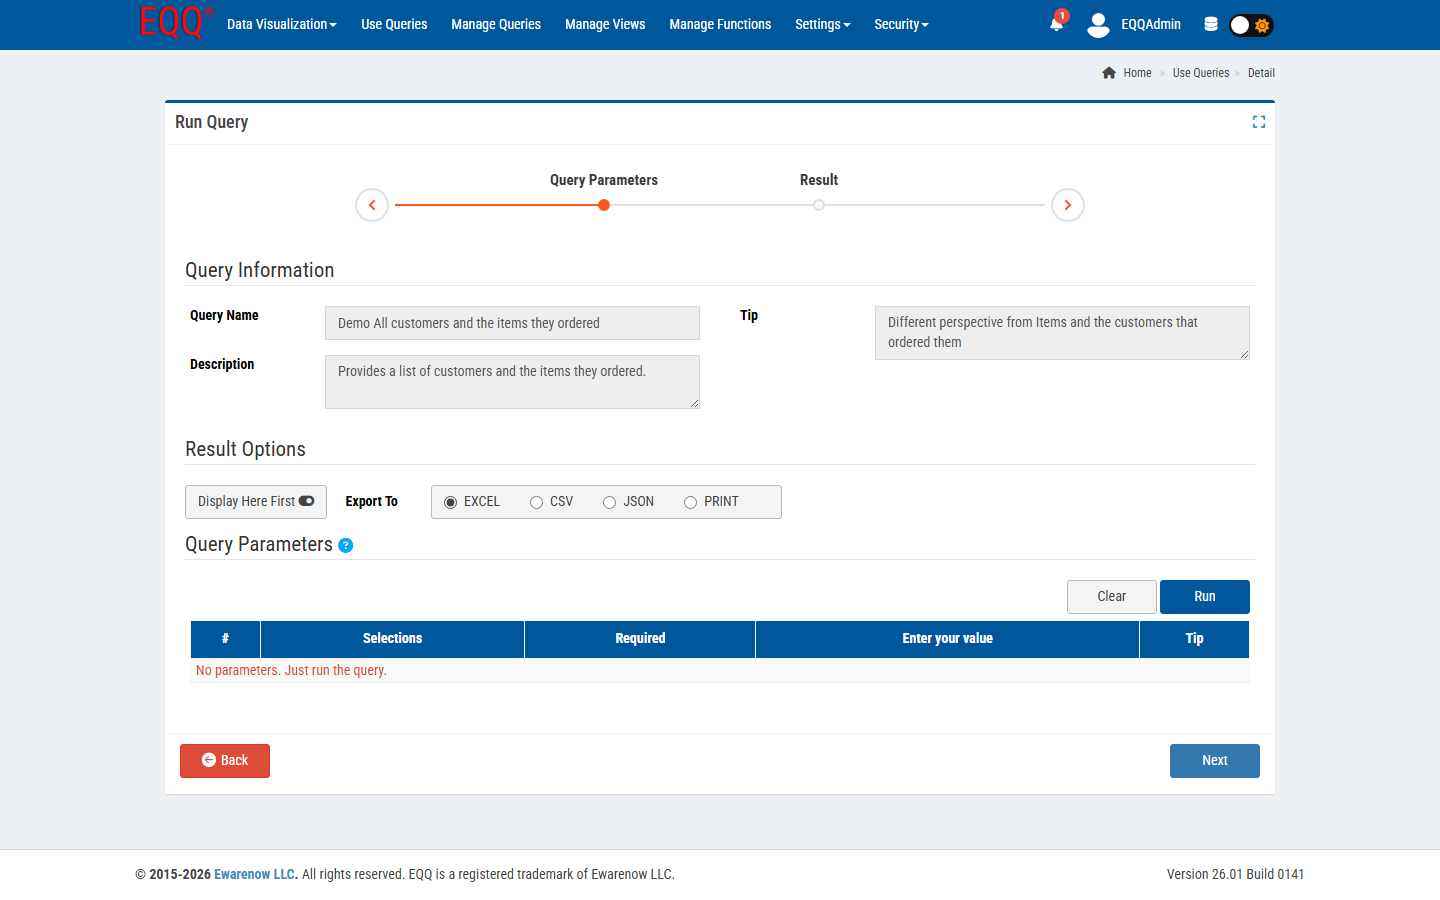
A two-step wizard, Query Parameters → Result:
- Query Information (read-only) - Query Name, Description, Tip.
- Result Options - Display Here First toggle, and Export To: EXCEL / CSV / JSON / PRINT.
- Query Parameters - one row per declared parameter (# / Selections / Required / Enter your value / Tip). A parameter marked required shows a plain red
*, not a colored badge - the Run button stays disabled until it's filled. If the query takes no parameters, a banner says so.
Actions: Clear resets inputs; Run executes (moves to the Result step if Display Here First is on, otherwise downloads directly); Back returns to the list; Next advances manually.
Filtering, sorting, and paging results
- Click a column header to sort.
- Type in the filter row under a header to narrow results in real time.
- Page size goes up to 100 rows on-screen; exports always contain the full result.
- Results over 5,000 rows stream automatically so the browser doesn't freeze - a banner appears when this happens.
- Excel exports are capped at roughly 1,048,576 rows per sheet (the Excel maximum); larger exports split across sheets. CSV and JSON have no practical row limit.
Lifecycle States
Only Active Queries and Views are usable by end users and APIs. The same six states apply to both:
| State | Icon tint | Meaning |
|---|---|---|
| In Process | Orange | Draft being edited. Never executable. |
| Saved | Cyan | Persisted draft. Still not executable. |
| Generated | Dark blue | SQL produced and validated. Ready to activate. |
| Active | Green | Live - visible in Use Queries / JSON API / Chart API. |
| Inactive | Grey | Hidden from users; can be re-activated. |
| Void | Black ∅ | Permanently retired. Audit trail kept; no edits allowed. |